The power of models
Published October 26, 2018
In our last post, we mentioned that, for the GBD, statistical estimation techniques make it possible to identify the most burdensome diseases, injuries, and risk factors in 195 countries and territories worldwide. But what do we mean by statistical estimation techniques? How do mathematical models help to combine all of the data that we collect and analyze to produce the estimates that the GBD publishes?
But first – what is a model?
Every day we encounter and use mathematical models. From producing weather predictions for the week, to calculating a country’s GDP, to estimating the impact of vaccinations, models help us process, represent, and understand the data that describe the workings of the world around us.
At the highest level, a model is the generation of a mathematical representation of the real world. Events are the data points that go into the model (inputs), and relationships are what come out (outputs).
Why use a model?
| TEST Mathematical models can help to see the “forest through the trees,” detect the patterns (the outputs) that most likely reflect the real world amid the noise of imperfect data (the inputs). Small sample sizes of studies, diverse methods, and all of the other variations that are introduced when trying to measure the same thing in different places or times – not to mention information gaps and other unknowns – can all lead to uncertainty in the data, and the model can help identify trends that would otherwise be difficult to detect. |
Models can look at events in the past, such as helping to show the impact of an Indonesian volcanic eruption in 1815 on summer climate patterns in the northern hemisphere in 1816 (known as the “year without summer,” when rains prevailed and crops failed across Europe and North America). And models can help with planning for the future – for example, here in IHME’s hometown of Seattle, local governments are trying to plan for public transit use. Models can also look at the here and now, such as the models used to estimate the gross domestic product (GDP) of a country, or the models that measure population health.
There are many more examples, in ways small and large, around us every day, from Netflix suggesting a new show to calculating the impact of one more year of education on a country’s potential economic growth. For these examples, the inputs – the data points – into each model are data such as “the viewer previously liked this show” and “a person got one more year of education in a particular country,” respectively.
These examples are just some of the many data points that go into any given model. Each model is built to take its particular data points and, from there, calculate relationships (outputs).
Models and the GBD
Models are used extensively in all kinds of health applications, including the Global Burden of Disease enterprise (GBD). The models that allow for these estimations are a complex series of interconnected calculations. Experts in diseases, risk factors, etc. develop each model. The models are then tested and vetted, with extensive review and debate by both the researchers and scientists at IHME and with our collaborators from around the world.
For every GBD cycle, every mathematical model is calculated for each age, sex, location, and year – from at least 1990 onward – in the study. This ensures that each cycle contains the most up-to-date estimates, reflecting all known advances in data, modeling, estimation methods, and health knowledge.
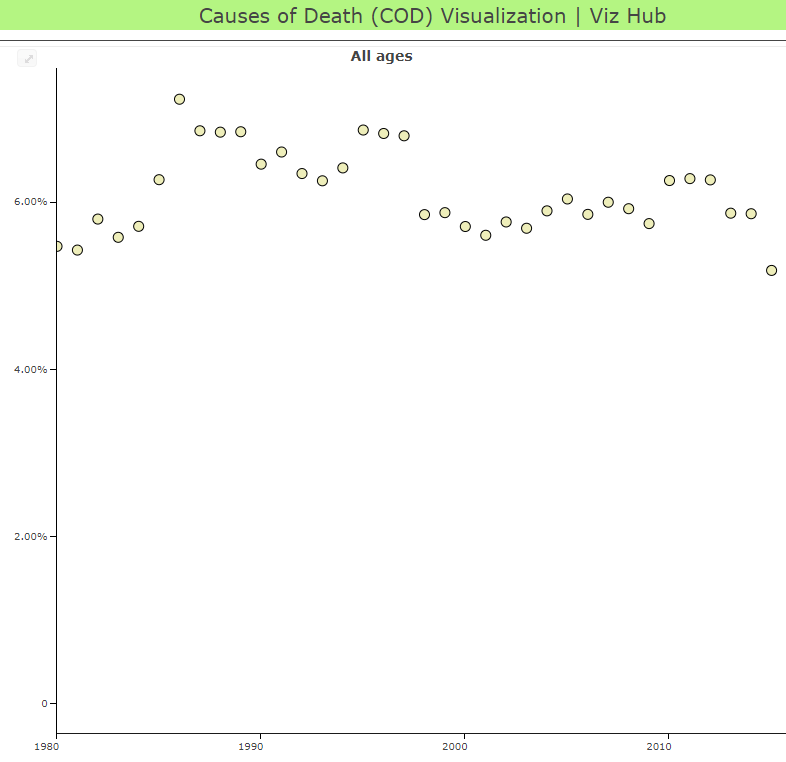
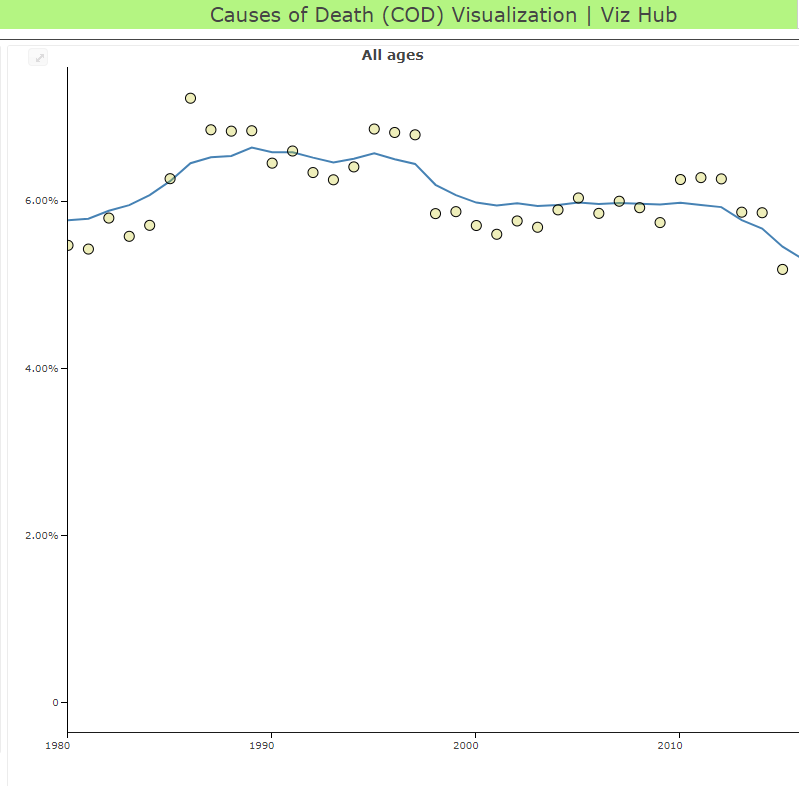
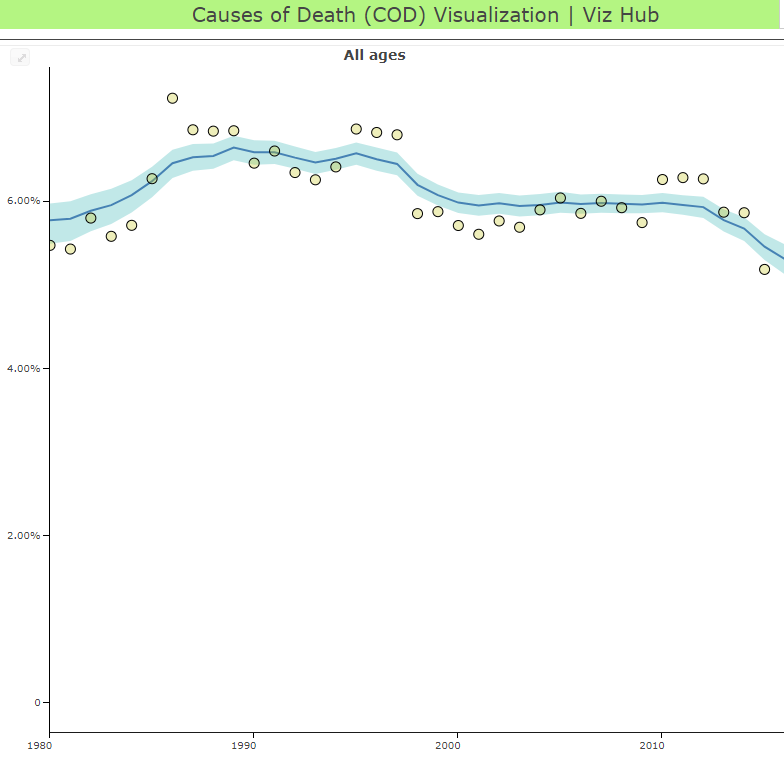
In the series of images below, which shows one model for one cause in one country, you can see the process from data points (the yellow dots), to average estimates (the blue line), to the range of possible values around the average estimate (the blue band). GBD researchers use models to determine the relationship between the known data points that we have, and then estimate the range of possible values (researchers call this the “uncertainty interval”).
 |  |  |
In this second example, you can see how the model creates a trend line between diverse data sources. In this example, of the prevalence of low back pain in France, the lines represent diverse data sources that show the wide variation of the measured prevalence. The blue path represents the uncertainty interval, as discussed above, and the dark blue line at the center represents the mapping of the prevalence, as shown by the model’s processing of the various data sources. You can see that the dark blue line does not exactly follow the data points; in fact, if it did, you would have a wide variation for the recorded prevalence of low back pain in France each year. The model instead finds the path – the forest – through the noise of the individual data points – the trees.
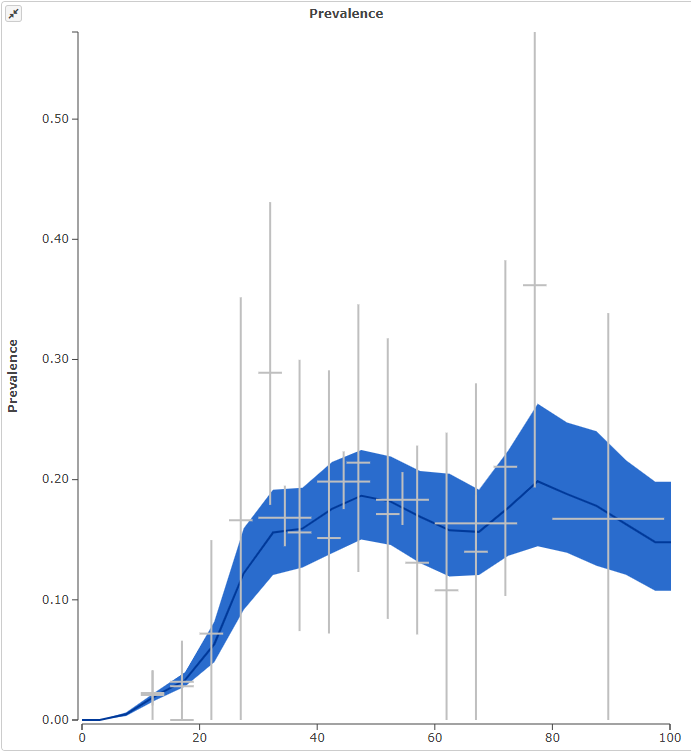
Citation: France: http://ihmeuw.org/4luq
For GBD, the first models – developed in the early 1990s – generated estimates for 107 diseases in eight regions and for five age groups. Since then, the models have continued to evolve not only to include more diseases, locations, and age groups, but to incorporate more data and ever more scientifically advanced methods of calculation. At IHME, we look across disciplines to learn from the many areas doing modeling, incorporating the latest advances into our own methods.
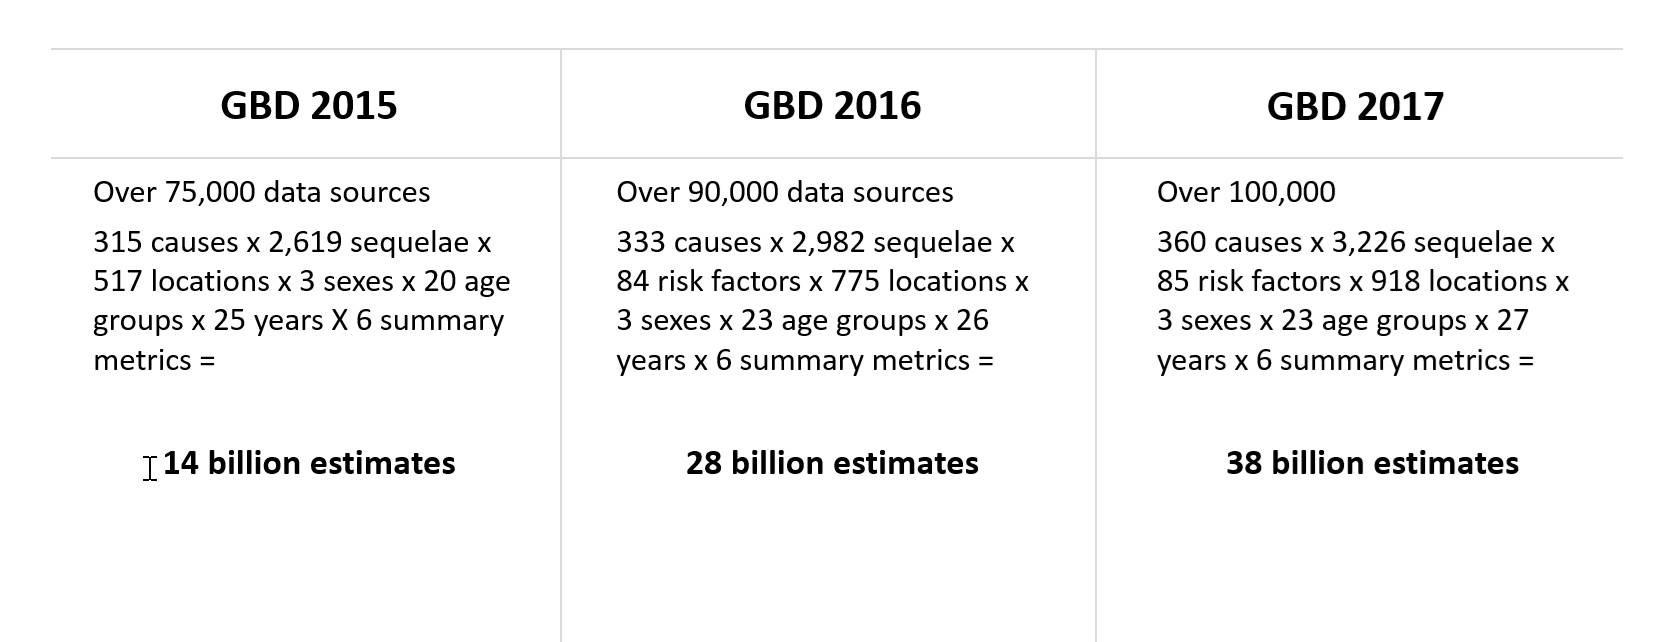
Caption: The number of inputs (data sources) into GBD models and the number of factors (causes, locations, etc.) considered for each round have grown substantially over the years of the GBD – resulting in stronger and more applicable population health estimates.
GBD models now consider thousands of data sources and millions of data points to produce measures of death and disability for hundreds of diseases and risks in countries around the world. Incorporating this many sources, and producing this many results, would not be possible without models.
In our next post we will discuss some of the measures that all of these models are producing, and how they are fundamental to the power and potential of GBD.
This post is part of the IHME Foundations series, which discusses some of the core aspects of IHME’s work while exploring along the way everything from how you manage over 50 databases with more than 39 billion rows (and what that even means) to how you help governments in Central America evaluate the impact of their health programs. Join us for the whole series here, or on Medium (hyperlink: https://medium.com/acting-on-data).