Jump to navigation

  • IHME
  • GHDx
  • GBD Compare
Home
Main menu
  • Home
  • Results
    • GBD Results Tool
    • Data Visualizations
    • Country Profiles
    • GBD 2019 Cause and Risk Summaries
    • US Health
    • Policy Reports
    • Research Articles
    • Infographics
    • Topics
    • Data & Tools
  • News & Events
    • News
    • Commentaries
    • Events
    • Videos
    • Acting on Data
      • IHME Foundations
  • Projects
    • COVID-19 resources
    • Global Burden of Disease (GBD)
    • Center for Health Trends and Forecasts (CHTF)
    • Disease Control Priorities Network (DCPN)
    • View all
  • Get Involved
    • Donate
    • Careers
    • Call for Collaborators
    • The Roux Prize
    • Murray-Lopez Award
    • Online Training
    • Courses
    • Degree programs
    • Workshops
  • About
    • Racism is a public health issue.
    • Our Principles
    • Faculty
    • Senior Management Team
    • Governance
    • History
    • GHDx
    • Terms and Conditions
    • Contact Us

Explore section

Results

  • GBD Results Tool
  • Data Visualizations
  • Country Profiles
  • GBD 2019 Cause and Risk Summaries
  • US Health
  • Policy Reports
  • Research Articles
  • Infographics
  • Topics
  • Data & Tools

King County Census Tracts Data Visualization


Twitter
Facebook
Google+
LinkedIn
Pinterest
Email
Print
Publication date: 
September 5, 2017

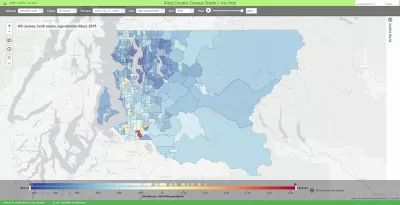
With this interactive map, you can explore trends in life expectancy and mortality from 152 causes of death in King County at the census tract level. Use the settings at the top to select a measure (life expectancy, mortality rate, or years of life lost rate), year, cause of death, and sex. Use the time trend menu on the right to explore time trends for specific census tracts.

Interact with the data visualization

BROWSER ISSUES

  • Use the latest version of Chrome, Edge, Internet Explorer (currently IE11), or Firefox.
  • Make sure to disable compatibility mode in Internet Explorer. In some cases, it renders a site unusable.
  • Use Ctrl+0 to reset the browser zoom. Sometimes having the browser zoomed in or out interferes with the layout or a few mouse-dependent properties.
  • If the visualization isn't loading or looks distorted, try clearing your cache. See http://www.wikihow.com/Clear-Your-Browser's-Cache for pointers.

Terms and conditions of use: 

For terms and conditions of use, please visit http://www.healthdata.org/about/terms-and-conditions

Related Content

Citation: 

Institute for Health Metrics and Evaluation (IHME). King County Census Tracts Data Visualization. Seattle, WA: IHME, University of Washington, 2017. Available from http://vizhub.healthdata.org/subnational/usa/wa/king-county. (Accessed [INSERT DATE])

News releases

Life expectancy varies by up to 18 years in King County
Depending on where you live, your life may be cut short by nearly two decades compared to others in your community, according to new census tract-level health analysis of Seattle and King County.

Publications

Variation in life expectancy and mortality by cause among neighborhoods in King County, WA, USA, 1990–2014: a census tract-level analysis for the Global Burden of Disease Study 2015
Health outcomes are known to vary at both the country and local levels, but trends in mortality across a detailed and comprehensive set of causes have not been previously described at a very local ...

Videos

Life expectancy in King County, WA, 2014
An animation to accompany the study titled, "Variation in life expectancy and mortality by cause among neighborhoods in King County, WA, USA, 1990–2014: a census tract-level analysis for the Glob...

Datasets

United States - King County, Washington Life Expectancy and Cause-Specific Mortality by Census Tract 1990-2014

Results

  • GBD Results Tool
  • Data Visualizations
  • Country Profiles
  • GBD 2019 Cause and Risk Summaries
  • US Health
  • Policy Reports
  • Research Articles
  • Infographics
  • Topics
  • Data & Tools

Sign up for IHME News

Stay connected


IHME

Institute for Health Metrics and Evaluation

Population Health Building/Hans Rosling Center

3980 15th Ave. NE, Seattle, WA 98195

UW Campus Box #351615

Tel: +1-206-897-2800

Fax: +1-206-897-2899

© 2020 University of Washington

  • Privacy policy
  • Login

  • Home
  • Results
    • GBD Results Tool
    • Data Visualizations
    • Country Profiles
    • GBD 2019 Cause and Risk Summaries
    • US Health
    • Policy Reports
    • Research Articles
    • Infographics
    • Topics
    • Data & Tools
  • News & Events
    • News
    • Commentaries
    • Events
    • Videos
    • Acting on Data
  • Projects
    • COVID-19 resources
    • Global Burden of Disease (GBD)
    • Center for Health Trends and Forecasts (CHTF)
    • Disease Control Priorities Network (DCPN)
    • View all
  • Get Involved
    • Donate
    • Careers
    • Call for Collaborators
    • The Roux Prize
    • Murray-Lopez Award
    • Online Training
    • Courses
    • Degree programs
    • Workshops
  • About
    • Racism is a public health issue.
    • Our Principles
    • Faculty
    • Senior Management Team
    • Governance
    • History
    • GHDx
    • Terms and Conditions
    • Contact Us

Projects

  • Global Burden of Disease (GBD)
  • Disease Control Priorities Network (DCPN)
  • ABCE+: A Focus on Antiretroviral Therapy (ART)
  • Access, Bottlenecks, Costs, and Equity (ABCE)
  • Efficacy to Effectiveness
  • Viral Load Pilot
  • Salud Mesoamérica Initiative
  • Improving Methods to Measure Comparable Mortality by Cause
  • Verbal Autopsy (VA)
  • Disease Expenditure (DEX)
  • Local Burden of Disease
  • State-level disease burden initiative in India
  • US Counties Drivers of Health Study
  • University of Washington Center for Health Trends and Forecasts