Double Burden of Malnutrition
Updated April 20, 2020
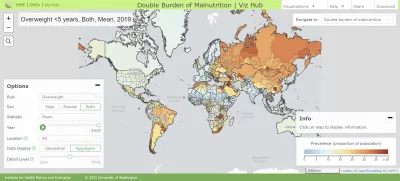
With this dynamic map visualization tool, explore local patterns in child overweight and wasting, from 2000 to 2019. Observe trends at multiple spatial scales – from entire nations to individual villages or 5-by-5 kilometer areas. Examine change over time and rates of decline needed to achieve the WHO Global Nutrition Targets by 2025 for each form of child growth failure. Search for specific countries, districts, and local areas to view trends. Easily share maps with others.
Citation
Institute for Health Metrics and Evaluation (IHME). Double Burden of Malnutrition. Seattle, WA: IHME, University of Washington, 2020. Available from http://vizhub.healthdata.org/lbd/cgf (Accessed [INSERT DATE])
Browser notes
- Use the latest version of Chrome, Safari, Edge, or Firefox.
- Use Ctrl+0 to reset the browser zoom. Sometimes having the browser zoomed in or out interferes with the layout or a few mouse-dependent properties.
- If the visualization isn't loading or looks distorted, try clearing your cache. See http://www.wikihow.com/Clear-Your-Browser's-Cachefor pointers.