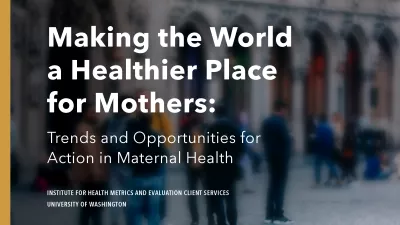
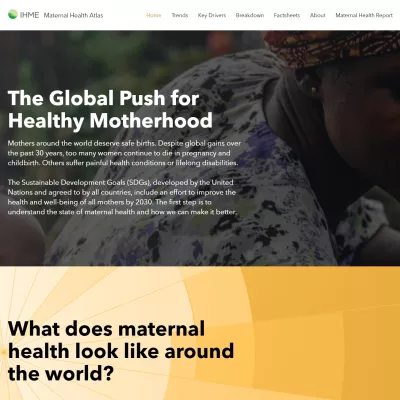
Jump to navigation

  • IHME
  • GHDx
  • GBD Compare
Home
Main menu
  • Home
  • Results
    • GBD Results Tool
    • Data Visualizations
    • Country Profiles
    • GBD 2019 Cause and Risk Summaries
    • US Health
    • Policy Reports
    • Research Articles
    • Infographics
    • Topics
      • Air pollution
      • Alcohol
      • Causes of Death
      • Child Health
      • Diet
      • Education
      • Health Financing
      • HIV/AIDS
      • Global Goals
      • Impact Evaluations
      • Maternal Health
        • Topic Home
        • Data Visualizations
        • Publications
        • Infographics
        • News & Events
      • Millennium Development Goals
      • Primary Data Collection
      • Risk Factors
      • Smoking & Tobacco
      • Social Determinants
      • US Health
    • Data & Tools
  • News & Events
    • News
    • Commentaries
    • Events
    • Videos
    • Acting on Data
      • IHME Foundations
  • Projects
    • COVID-19 resources
    • Global Burden of Disease (GBD)
    • Center for Health Trends and Forecasts (CHTF)
    • Disease Control Priorities Network (DCPN)
    • View all
  • Get Involved
    • Donate
    • Careers
    • Call for Collaborators
    • The Roux Prize
    • Murray-Lopez Award
    • Online Training
    • Workshops
  • About
    • Our Principles
    • Racism is a public health issue.
    • Senior Management Team
    • Faculty
    • Governance
    • History
    • GHDx
    • Terms and Conditions
    • Contact Us

Explore section

Maternal Health

  • Topic Home
  • Data Visualizations
  • Publications
  • Infographics
  • News & Events

Maternal Health Data Visualizations


October 15, 2020
GBD Compare
Data Visualization
Analyze updated data about the world’s health levels and trends from 1990 to 2019 in this interactive tool using estimates from the Global Burden of Disease (GBD) study. Compare causes, injuries, and risks within a country, compare countries with regions or the world, and explore patterns and trends by country, age, and gender. 
October 15, 2020
Causes of Death (COD) Visualization
Data Visualization
Where do we have the best data on different health conditions? For any age group, see where various data sources have placed trends in causes of death over time. You can examine more than 350 causes in both adjusted and pre-adjusted numbers, rates, and percentages for 204 countries and territories.
April 23, 2020
Financing Global Health
Data Visualization
Explore patterns of global health financing flows from 1990 to 2050 in an updated tool. View trends in global health spending with interactive bar charts, maps, and line graphs. For the first time, see tuberculosis spending estimates for low- and middle-income countries from 2000 to 2017.
November 12, 2019
Maternal Health Atlas
Data Visualization
What are the greatest threats to a mother’s health? Explore causes of death or disability in women, and compare how the biggest threats to maternal health in different countries have changed over time using the Maternal Health Atlas.
June 26, 2017
Social Determinants of Health Visualization
Data Visualization
The Social Determinants of Health visualization tool allows you to explore the relationships between determinants of health and health indicators across countries. This second release of the tool presents antenatal care visits, skilled birth attendance, measles and DPT3 immunization coverage, lag distributed income, and educational attainment. Users can visualize the relationships between these determinants and life expectancy, disability-adjusted life years (DALYs) by cause, years lived with disability (YLDs) by cause, and causes of death. Additional determinants and indicators will be added to the tool in subsequent releases.
July 21, 2014
Millennium Development Goals (MDGs) Visualization
Data Visualization
This interactive data visualization tool allows you to compare and contrast progress achieved among 188 countries in meeting each of the health-related Millennium Development Goals (MDGs).

Maternal Health

  • Topic Home
  • Data Visualizations
  • Publications
  • Infographics
  • News & Events

Sign up for IHME News

Stay connected


IHME

Institute for Health Metrics and Evaluation

Population Health Building/Hans Rosling Center

3980 15th Ave. NE, Seattle, WA 98195

UW Campus Box #351615

Tel: +1-206-897-2800

Fax: +1-206-897-2899

© 2020 University of Washington

  • Privacy policy
  • Login

  • Home
  • Results
    • GBD Results Tool
    • Data Visualizations
    • Country Profiles
    • GBD 2019 Cause and Risk Summaries
    • US Health
    • Policy Reports
    • Research Articles
    • Infographics
    • Topics
    • Data & Tools
  • News & Events
    • News
    • Commentaries
    • Events
    • Videos
    • Acting on Data
  • Projects
    • COVID-19 resources
    • Global Burden of Disease (GBD)
    • Center for Health Trends and Forecasts (CHTF)
    • Disease Control Priorities Network (DCPN)
    • View all
  • Get Involved
    • Donate
    • Careers
    • Call for Collaborators
    • The Roux Prize
    • Murray-Lopez Award
    • Online Training
    • Workshops
  • About
    • Our Principles
    • Racism is a public health issue.
    • Senior Management Team
    • Faculty
    • Governance
    • History
    • GHDx
    • Terms and Conditions
    • Contact Us

Projects

  • Global Burden of Disease (GBD)
  • Disease Control Priorities Network (DCPN)
  • ABCE+: A Focus on Antiretroviral Therapy (ART)
  • Access, Bottlenecks, Costs, and Equity (ABCE)
  • Efficacy to Effectiveness
  • Viral Load Pilot
  • Salud Mesoamérica Initiative
  • Improving Methods to Measure Comparable Mortality by Cause
  • Verbal Autopsy (VA)
  • Disease Expenditure (DEX)
  • Local Burden of Disease
  • State-level disease burden initiative in India
  • US Counties Drivers of Health Study
  • University of Washington Center for Health Trends and Forecasts