Jump to navigation

  • IHME
  • GHDx
  • GBD Compare
Home
Main menu
  • Home
  • Results
    • GBD Results Tool
    • Data Visualizations
    • Country Profiles
    • GBD 2019 Cause and Risk Summaries
    • US Health
    • Policy Reports
    • Research Articles
    • Infographics
    • Topics
    • Data & Tools
  • News & Events
    • News
    • Commentaries
    • Events
    • Videos
    • Acting on Data
      • IHME Foundations
  • Projects
    • COVID-19 resources
    • Global Burden of Disease (GBD)
    • Center for Health Trends and Forecasts (CHTF)
    • Disease Control Priorities Network (DCPN)
    • View all
  • Get Involved
    • Donate
    • Careers
    • Call for Collaborators
    • The Roux Prize
    • Online Training
    • Workshops
  • About
    • Our Principles
    • Racism is a public health issue.
    • Senior Management Team
    • Faculty
    • Governance
    • History
    • GHDx
    • Terms and Conditions
    • Contact Us

Explore section

Results

  • GBD Results Tool
  • Data Visualizations
  • Country Profiles
  • GBD 2019 Cause and Risk Summaries
  • US Health
  • Policy Reports
  • Research Articles
  • Infographics
  • Topics
  • Data & Tools

Data Visualizations


Subscribe to Data Visualizations | IHME
Advanced
April 7, 2021
Lymphatic Filariasis
Data Visualization
Learn more

Explore local patterns of lymphatic filariasis infection prevalence globally from 2000 to 2018 with this interactive visualization tool. 

April 7, 2021
Male Circumcision
Data Visualization
Learn more

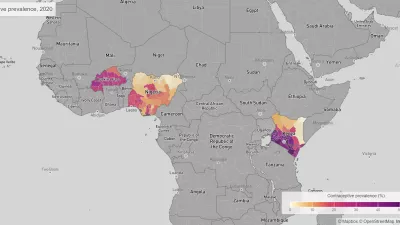
Explore local patterns of male circumcision prevalence from 2000 to 2017 with this interactive visualization tool. 

April 7, 2021
MCV Coverage
Data Visualization
Learn more

Explore local patterns of annual childhood MCV1 coverage estimates from 2000 to 2019 with this interactive visualization tool. 

April 7, 2021
Tuberculosis
Data Visualization
Learn more

Explore local patterns of tuberculosis prevalence and mortality from 2000 to 2017 with this interactive visualization tool. 

April 7, 2021
Water, Sanitation, and Hygiene
Data Visualization
Learn more

Explore local patterns of access to drinking water and sanitation facilities from 2000 to 2017 with this interactive visualization tool. 

April 7, 2021
Oral Rehydration Therapy
Data Visualization
Learn more

Explore local patterns of coverage of oral rehydration solution (ORS), recommended home fluids (RHF), and oral rehydration therapy (ORT) – the use of either ORS or RHF – from 2000 to 2017 with this interactive visualization tool. 

January 8, 2021
HIV Mortality – Latin America
Data Visualization
Learn more

Explore local patterns of HIV mortality in Latin America from 2000 to 2017 with this interactive visualization tool. 

April 20, 2020
Double Burden of Malnutrition
Data Visualization
Learn more

With this dynamic map visualization tool, explore local patterns in child overweight and wasting, from 2000 to 2019. Observe trends at multiple spatial scales and search to view trends in specific countries and local areas. 

January 8, 2020
Child Growth Failure
Data Visualization
Learn more

With this dynamic map visualization tool, explore local patterns in child stunting, wasting, and underweight across all low- and middle-income countries from 2000 to 2017. Observe trends at multiple spatial scales and search to view trends in specific countries and local areas. 

December 25, 2019
Education
Data Visualization
Learn more

With this interactive map visualization, explore local patterns in educational attainment across all low- and middle-income countries from 2000 to 2017. Compare how years of education vary between men and women and across two different age groups. Observe trends at multiple spatial scales and search to view trends in specific countries and local areas.

October 16, 2019
Under-5 mortality
Data Visualization
Learn more

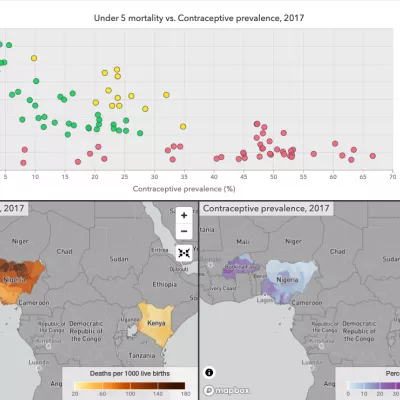
With this interactive mapping tool, explore localized child, infant, and neonate mortality trends in 99 low- and middle-income countries from 2000 to 2017. Observe trends at different spatial resolutions, examine change over time, and understand the improvement rates needed to achieve the United Nations Sustainable Development Goal (SDG) target for ending preventable child deaths. Drill down to uncover trends in specific countries, districts, and local areas. Easily share maps with others.

October 16, 2019
Child Mortality 2000-2017
Data Visualization
Learn more

In 2000, 9.7 million children died before their 5th birthday. Between 2000 and 2017, global child death rates decreased significantly, saving millions of children. By 2017, the number of child deaths dropped to 5.4 million. Helping children survive and thrive is one of the most important global goals for health and development.


September 30, 2019
Lower Respiratory Infections
Data Visualization
Learn more

Explore patterns of lower respiratory infections across Africa from 2000 to 2017 with this interactive visualization tool. Compare prevalence, incidence, and mortality at multiple spatial scales and years, and search for specific areas to view local trends.

July 22, 2019
Exclusive Breastfeeding (EBF)
Data Visualization
Learn more

Explore local patterns of exclusive breastfeeding among infants ages 0–6 months across Africa from 2000 to 2017 with this interactive visualization tool.

June 19, 2019
Malaria
Data Visualization
Learn more

Explore local patterns of malaria prevalence, incidence, and mortality from 2000 to 2017 with this interactive visualization tool.

May 15, 2019
HIV
Data Visualization
Learn more

Explore local patterns of HIV prevalence from 2000 to 2017 with this interactive visualization tool. 

April 11, 2019
Vaccines
Data Visualization
Learn more

Explore local patterns of diphtheria, pertussis and tetanus (DPT) vaccination coverage across Africa from 2000 to 2016 with this interactive visualization tool. 

September 19, 2018
Diarrhea
Data Visualization
Learn more

Explore local patterns of diarrhea burden across Africa from 2000 to 2015 with this interactive visualization tool. Compare diarrheal prevalence, incidence, and mortality at multiple spatial scales – from values at the country level to estimates for individual districts and departments. Search for specific areas to view local trends, and share your findings with others. Observe temporal patterns of improvement, and examine the probability of achieving the WHO Global Action Plan for Pneumonia and Diarrhea (GAPPD) goals. 

October 11, 2017
Spatial epidemiology of Viral Hemorrhagic Fevers
Data Visualization
Learn more

With this interactive mapping tool, explore local assessments of where in Africa specific infectious diseases (Ebola virus disease, Marburg virus disease, Lassa fever, and Crimean-Congo hemorrhagic fever) have the greatest potential to emerge and subsequently spread. 


Results

  • GBD Results Tool
  • Data Visualizations
  • Country Profiles
  • GBD 2019 Cause and Risk Summaries
  • US Health
  • Policy Reports
  • Research Articles
  • Infographics
  • Topics
  • Data & Tools

Stay connected


IHME

Institute for Health Metrics and Evaluation

Population Health Building/Hans Rosling Center

3980 15th Ave. NE, Seattle, WA 98195

UW Campus Box #351615

Tel: +1-206-897-2800

Fax: +1-206-897-2899

© 2020 University of Washington

  • Privacy policy
  • Login

  • Home
  • Results
    • GBD Results Tool
    • Data Visualizations
    • Country Profiles
    • GBD 2019 Cause and Risk Summaries
    • US Health
    • Policy Reports
    • Research Articles
    • Infographics
    • Topics
    • Data & Tools
  • News & Events
    • News
    • Commentaries
    • Events
    • Videos
    • Acting on Data
  • Projects
    • COVID-19 resources
    • Global Burden of Disease (GBD)
    • Center for Health Trends and Forecasts (CHTF)
    • Disease Control Priorities Network (DCPN)
    • View all
  • Get Involved
    • Donate
    • Careers
    • Call for Collaborators
    • The Roux Prize
    • Online Training
    • Workshops
  • About
    • Our Principles
    • Racism is a public health issue.
    • Senior Management Team
    • Faculty
    • Governance
    • History
    • GHDx
    • Terms and Conditions
    • Contact Us

Projects

  • Global Burden of Disease (GBD)
  • Disease Control Priorities Network (DCPN)
  • ABCE+: A Focus on Antiretroviral Therapy (ART)
  • Access, Bottlenecks, Costs, and Equity (ABCE)
  • Efficacy to Effectiveness
  • Viral Load Pilot
  • Salud Mesoamérica Initiative
  • Improving Methods to Measure Comparable Mortality by Cause
  • Verbal Autopsy (VA)
  • Disease Expenditure (DEX)
  • State-level disease burden initiative in India
  • US Counties Drivers of Health Study
  • University of Washington Center for Health Trends and Forecasts