Smoking and tobacco
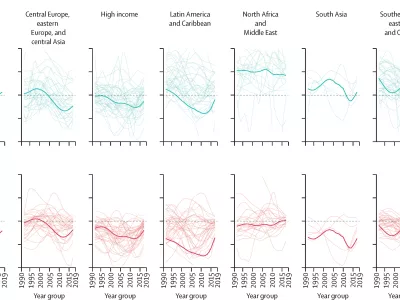
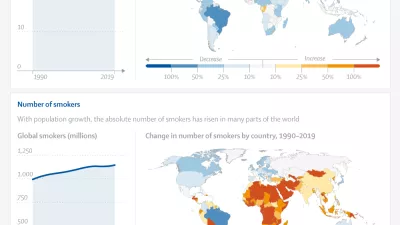
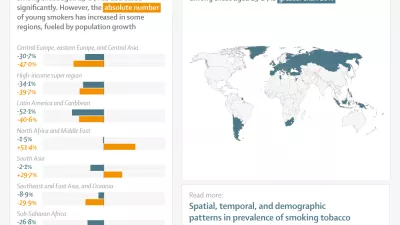
Tobacco is a clearly damaging risk factor to health, significantly contributing to the burden of many non-communicable diseases, and even to some communicable diseases. While smoking prevalence has decreased over the past 30 years, the total number of smokers worldwide has continued to increase due to population growth.
Photo by Reuters/Pablo La Rosa.
1.14 billion
people around the world were smokers in 2019.
155 million
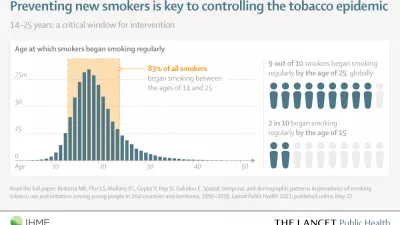
global smokers in 2019 were between the ages of 15 and 24 years old.
7.69 million
deaths were attributable to smoked tobacco use globally in 2019.
200 million
disability-adjusted life years (DALYs) in 2019 were attributed to smoked tobacco use globally.
Interactive data visuals
Datasets in our catalog
Visit the Global Health Data Exchange (GHDx) to download our estimates and data sources for smoking and tobacco.
United States Behavioral Risk Factor Surveillance System (BRFSS)
Series
United States Behavioral Risk Factor Surveillance System (BRFSS)
Latest global data finds nearly 8 million deaths from smoking in 2019