Making GBD data sources speak a universal language
Published July 13, 2018

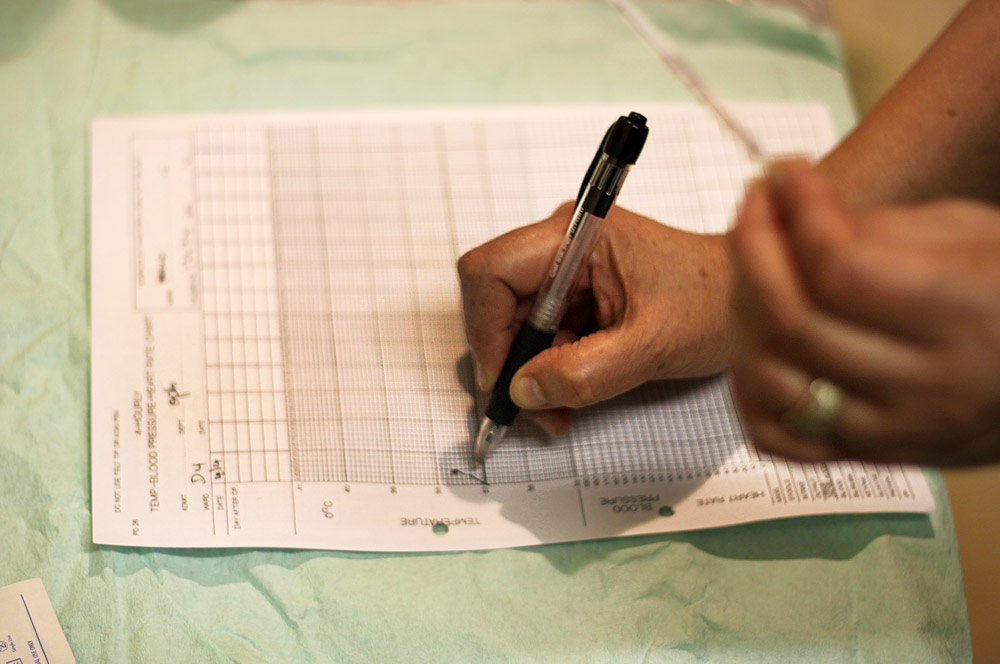
Photo by Elmien Wolvaart Ellison, 2013.
As we mentioned in our last post, the Global Burden of Disease (GBD) study relies on a lot of data – over 90,000 data sources, in fact. And each of these data sources (everything from scientific articles to municipal surveys) has their own distinct way of collecting information and measuring health. For example, some surveys will use self-reported weight data from study participants, while other surveys will actually measure the weight of the participants during the survey. These different measurement techniques can lead to very different weight estimates.
So, how do we make these sources speak the same language?
First, the data must be cleaned. Even large survey data often includes duplicates or implausible values, such as biologically-impossible blood pressure values and cervical cancer reported in men. After reviewing the data in-depth, these data points are sometimes dropped so that we are not including values that would incorrectly skew the results.
Our network of more than 3,500 collaborators across the world is integral to this data vetting process. They are familiar with the contexts in which these data are collected and help us spot and understand oddities in the data. For example, experts pointed out that there was an oddly sharp decline in upper respiratory infections in an area of the world in 1990 among women aged 40 to 79 years. As we dug deeper, we found the trend was largely due to lack of data in the area and was resolved by adding additional data sources from this location. This is just one example of how collaborators help us to uncover nuances in the data through their on-the-ground knowledge. Experts also help us to identify places where we are missing data and, in some cases, help us to find these sources. This inside scoop allows us to tell a more accurate story of the context on the ground.
Other times, it is not a question of excluding data points but rather “re-assigning” them to something that is more logical. For instance, a vital registration system may report that a 20-year-old died from Alzheimer’s or that a teenager died from acne. In both of these cases, these deaths would be reassigned to what is more likely to be the actual underlying cause of death given their demographic profile, place of residence, and year of death. (Learn more about this re-assigning in our next post!)
Once the data are cleaned, researchers have to align definitions. Diseases and risk factors are often defined and measured very differently depending on the data source. For example, think about if you had to measure how much salt you had eaten today. Some surveys measure an individual’s daily salt intake through a urine test, while others measure based on “diet recall,” such as asking people what they ate over the last 24 hours. As you might expect, the urine test is going to more accurately measure someone’s salt intake, but these studies are more expensive and less common. So, rather than eliminate the diet recall studies, we have to figure out how much people are under- or over-reporting their salt intake, on average, and adjust those values to reflect what we would get if we had done a urine test on that person. Again, our collaborators and expert research teams are key to this analysis.
We also have to correct for known issues in the data. In the salt example, we correct the results of surveys where people are asked to estimate their salt intake over the past week because people are notoriously inconsistent at remembering their salt intake. In other cases, there are more active reporting issues that affect the results. For example, on average, women in the United States tend to underestimate their weight, while men tend to overestimate their height. We have to make corrections for these known population-level patterns in self-reported data in order to get an accurate sense of true BMI in a population.
Our teams of researchers and analysts tackle this data vetting and cleaning as best as possible when we first get the data, but this remains an ongoing process as we continue to familiarize ourselves with a data source and notice new oddities and patterns in the data. According to NY Times research, data cleaning takes up, on average, 50 to 80 percent of a researcher’s time, even before they can get to any analysis. For a study like GBD, where we use so many diverse data sources, this stage of the process is crucial!
In our next post, we’ll take a deeper dive in to one particular aspect of this: the re-assigning of miscoded causes of death.
This post is part of the IHME Foundations series, which discusses some of the core aspects of IHME’s work while exploring along the way everything from how you manage over 50 databases with more than 39 billion rows (and what that even means) to how you help governments in Central America evaluate the impact of their health programs. Join us for the whole series here, or on Medium.