Jump to navigation

  • Contact us
  • Data catalog (GHDx)
  • Research library
Home
Main menu
  • Home
  • Research and analysis
    • Global Burden of Disease (GBD)
    • Health policy and planning
    • Health by location
    • Health risks and issues
    • Diseases and conditions
    • Training on our research
    • Research and news library
  • Data tools and practices
    • Interactive data visuals
    • Data sources
    • How we collect data
    • Data practices
    • Verbal autopsy tool
    • Training on tools
    • Data for the private sector
  • News and events
    • News media
    • Blogs
    • Events
    • Media contacts
  • About us
    • Mission and vision
    • Diversity, Equity, and Inclusion
    • Our people
    • Awards
    • Careers
    • History
    • Governance
    • Contact us

Explore section

Data Tools and Practices

  • Interactive data visuals
  • Data sources
  • How we collect data
  • Data practices
  • Verbal autopsy tool
  • Training on tools
  • Data for the private sector

Interactive data visuals


Subscribe to Data Visualizations | IHME
Advanced
March 26, 2020
COVID-19 projections
Data Visualization
Learn more

IHME's COVID-19 projections were developed in response to requests from the University of Washington School of Medicine and other US hospital systems and state governments working to determine when COVID-19 would overwhelm their ability to care for patients. The forecasts show demand for hospital services, reported and excess deaths due to COVID-19, rates of infection and testing, and the impact of social distancing, organized by country and state (for select locations).

January 8, 2020
Child Growth Failure
Data Visualization
Learn more

With this dynamic map visualization tool, explore local patterns in child stunting, wasting, and underweight across all low- and middle-income countries from 2000 to 2017. Observe trends at multiple spatial scales and search to view trends in specific countries and local areas. 

December 25, 2019
Education
Data Visualization
Learn more

With this interactive map visualization, explore local patterns in educational attainment across all low- and middle-income countries from 2000 to 2017. Compare how years of education vary between men and women and across two different age groups. Observe trends at multiple spatial scales and search to view trends in specific countries and local areas.

November 26, 2019
The Importance of Tobacco Control in Mexico
Data Visualization
Learn more

In this data visualization, we examine current and past trends in tobacco use across Mexico to understand where progress has been made and where gaps still exist. Given recent statistical innovations, we can also forecast into the future.

November 12, 2019
Maternal Health Atlas
Data Visualization
Learn more

What are the greatest threats to a mother’s health? Explore causes of death or disability in women, and compare how the biggest threats to maternal health in different countries have changed over time using the Maternal Health Atlas.

October 16, 2019
Child Mortality 2000-2017
Data Visualization
Learn more

In 2000, 9.7 million children died before their 5th birthday. Between 2000 and 2017, global child death rates decreased significantly, saving millions of children. By 2017, the number of child deaths dropped to 5.4 million. Helping children survive and thrive is one of the most important global goals for health and development.


October 16, 2019
Under-5 mortality
Data Visualization
Learn more

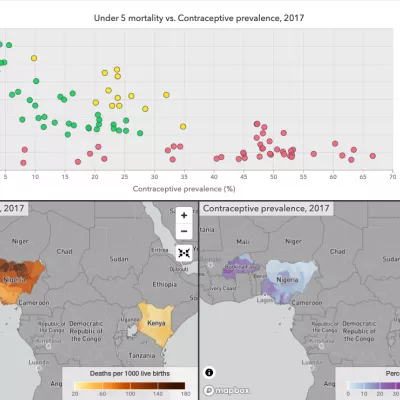
With this interactive mapping tool, explore localized child, infant, and neonate mortality trends in 99 low- and middle-income countries from 2000 to 2017. Observe trends at different spatial resolutions, examine change over time, and understand the improvement rates needed to achieve the United Nations Sustainable Development Goal (SDG) target for ending preventable child deaths. Drill down to uncover trends in specific countries, districts, and local areas. Easily share maps with others.

September 30, 2019
Lower Respiratory Infections
Data Visualization
Learn more

Explore patterns of lower respiratory infections globally from 2000 to 2019 with this interactive visualization tool. Compare prevalence, incidence, and mortality at multiple spatial scales and years, and search for specific areas to view local trends.

July 22, 2019
Exclusive Breastfeeding (EBF)
Data Visualization
Learn more

Explore local patterns of exclusive breastfeeding among infants ages 0–6 months across Africa from 2000 to 2017 with this interactive visualization tool.

June 19, 2019
Malaria
Data Visualization
Learn more

Explore local patterns of malaria prevalence, incidence, and mortality from 2000 to 2017 with this interactive visualization tool.

May 15, 2019
HIV
Data Visualization
Learn more

Explore local patterns of HIV prevalence from 2000 to 2017 with this interactive visualization tool. 

April 11, 2019
Vaccines
Data Visualization
Learn more

Explore local patterns of diphtheria, pertussis and tetanus (DPT) vaccination coverage across Africa from 2000 to 2016 with this interactive visualization tool. 

December 14, 2018
China Subnational MDG 4/5
Data Visualization
Learn more

See how China is progressing toward Millennium Development Goal 4 and 5 (MDG 4/5) at the subnational level by exploring and comparing province and county trends for under-5 mortality rates and maternal mortality ratio in China in the past two decades.

December 1, 2018
HIV Atlas
Data Visualization
Learn more

Explore the burden of HIV/AIDS over time and simulate future HIV/AIDS outcomes that could result from scenarios exploring decreases in development assistance funding.

November 8, 2018
Health-related SDGs
Data Visualization
Learn more

With this tool, users can explore progress made toward achieving the United Nations Sustainable Development Goals (SDGs). Measure progress made by 195 countries and territories from 1990 to 2017 and projecting attainment to 2030 toward 41 health-related indicators. See how countries have progressed over time. Share and download figures for later use.

October 16, 2018
GBD Foresight Visualization
Data Visualization
Learn more

Analyze forecasts and alternative better and worse scenarios from 2017 to 2040 for 250 causes of death, life expectancy, years of life lost (YLLs) as well as risk-attributable deaths and YLLs. Use treemaps, arrow diagrams, decomposition plots, line charts, maps and others to compare across countries and with regions of the world. 

September 19, 2018
Diarrhea
Data Visualization
Learn more

Explore local patterns of diarrhea burden across the world from 2000 to 2019 with this interactive visualization tool. Compare diarrheal prevalence, incidence, and mortality at multiple spatial scales – from values at the country level to estimates for individual districts and departments. Search for specific areas to view local trends, and share your findings with others. Observe temporal patterns of improvement, and examine the probability of achieving the WHO Global Action Plan for Pneumonia and Diarrhea (GAPPD) goals. 

July 28, 2018
Hepatitis Atlas
Data Visualization
Learn more

Explore how hepatitis impacts populations globally in this disease atlas with simple tools and data visualizations highlighting global burden and country trends.

December 11, 2017
Forecasting child growth failure
Data Visualization
Learn more

This interactive data visualization tool shows levels and trends in growth failure at birth and in children under 5, both past and projected from 1990 to 2030. Explore results for countries, regions, and the globe alongside the data. 

November 7, 2017
Tracking personal health care spending in the US
Data Visualization
Learn more

Explore US health care spending for 155 conditions for the years 1996 through 2016. Use the interactive Sankey diagram, treemap, and pyramid chart to analyze trends by age, sex, type of care, condition, and payer. New in Nov 2017: view how different factors drove changes in spending.

October 11, 2017
Spatial epidemiology of Viral Hemorrhagic Fevers
Data Visualization
Learn more

With this interactive mapping tool, explore local assessments of where in Africa specific infectious diseases (Ebola virus disease, Marburg virus disease, Lassa fever, and Crimean-Congo hemorrhagic fever) have the greatest potential to emerge and subsequently spread. 

September 5, 2017
King County Census Tracts Data Visualization
Data Visualization
Learn more

With this interactive map, you can explore trends in life expectancy and mortality from 152 causes of death in King County at the census tract level. Use the settings at the top to select a measure (life expectancy, mortality rate, or years of life lost rate), year, cause of death, and sex. Use the time trend menu on the right to explore time trends for specific census tracts.

April 5, 2017
Tobacco Visualization
Data Visualization
Learn more

This interactive data visualization tool shows modeled trends in smoking prevalence worldwide and by country for the years 1980 to 2015. Data were derived from nationally representative sources that measured tobacco use. Note: the data in this tool was last updated in 2017.

October 20, 2015
HIV Worldwide 1990-2013 Visualization
Data Visualization
Learn more

Created for The Journal of the American Medical Association, this interactive data visualization tool shows estimated trends in HIV/AIDS death, incidence, and prevalence worldwide and by country for the years 1990 to 2013. Note: the data in this tool was last updated in 2015.

May 15, 2015
National Health Accounts (NHA) Visualization
Data Visualization
Learn more

Who provides funds for health? Who manages the spending? What goods and services are purchased? Who provides which services? Explore allocation of expenditure across time, country, and categories of spending, as reported in National Health Accounts (NHAs).

Pages

  • « first
  • ‹ previous
  • 1
  • 2

Data Tools and Practices

  • Interactive data visuals
  • Data sources
  • How we collect data
  • Data practices
  • Verbal autopsy tool
  • Training on tools
  • Data for the private sector

Stay connected


Sign up for our newsletter

  • Contact us
  • Donate
  • Privacy policy

© 2023

         Home to Highly Cited Researchers 2022, Clarivate

  • Home
  • Research and analysis
    • Global Burden of Disease (GBD)
    • Health policy and planning
    • Health by location
    • Health risks and issues
    • Diseases and conditions
    • Training on our research
    • Research and news library
  • Data tools and practices
    • Interactive data visuals
    • Data sources
    • How we collect data
    • Data practices
    • Verbal autopsy tool
    • Training on tools
    • Data for the private sector
  • News and events
    • News media
    • Blogs
    • Events
    • Media contacts
  • About us
    • Mission and vision
    • Diversity, Equity, and Inclusion
    • Our people
    • Awards
    • Careers
    • History
    • Governance
    • Contact us