
Mapping Ebola to prepare for future outbreaks
Published April 20, 2016
Prior to the recent West African Ebola outbreak, many countries had never considered the virus an imminent threat.
 Ebola was only discovered in 1976, and until March 2014 Ebola deaths were sporadic and scattered across Africa, with the highest number of reported cases being 425. Because of Ebola’s rarity in some African countries there was little to no surveillance, preventive planning, or intervention strategy in place if an outbreak should occur. What had once been a virus responsible for hundreds of deaths mainly in the Democratic Republic of the Congo (DRC) and Uganda turned into an epidemic that crossed borders and from 2014 until now has resulted in more than 28,000 cases and 11,000 deaths.
“The Ebola outbreak in West Africa was a big surprise to the West Africans. Even to me,” said Prof. Osman Sankoh, Executive Director of the INDEPTH Network. “I knew what Ebola was, but I never thought Ebola would surface in a country like Sierra Leone, where I am from, and Ghana, Nigeria, and the others. And no one thought that this would become an issue, but then it did.”
Illustrating Ebola’s potential spread, risk
After the 2014-2015 West African Ebola outbreak, Dr. David Pigott, IHME Assistant Professor, and Prof. Simon Hay, IHME Director of Geospatial Science, became interested in understanding areas at greatest risk of future Ebola virus disease outbreaks. They decided to apply geospatial analysis techniques, used to improve the spatial resolution at which we map diseases, to create an Ebola Mapping Tool that produces a geographical picture of the potential risk of an Ebola outbreak in Africa.
Ebola Virus Disease (EVD) is a zoonotic disease, meaning that it can be passed between animals and humans. The long-term or reservoir hosts of the Ebola virus are several different bat species, though primates can also become infected and transmit the disease to humans. One way in which Ebola is commonly spread is through the exposure of blood, while hunting and preparing animals infected with the Ebola virus disease.
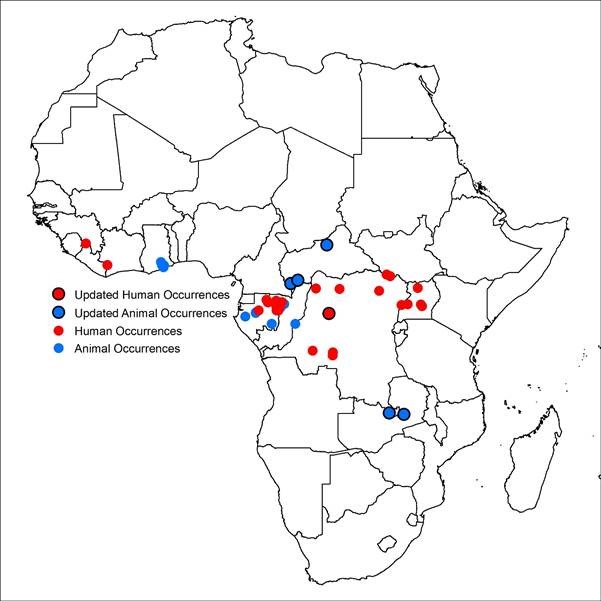
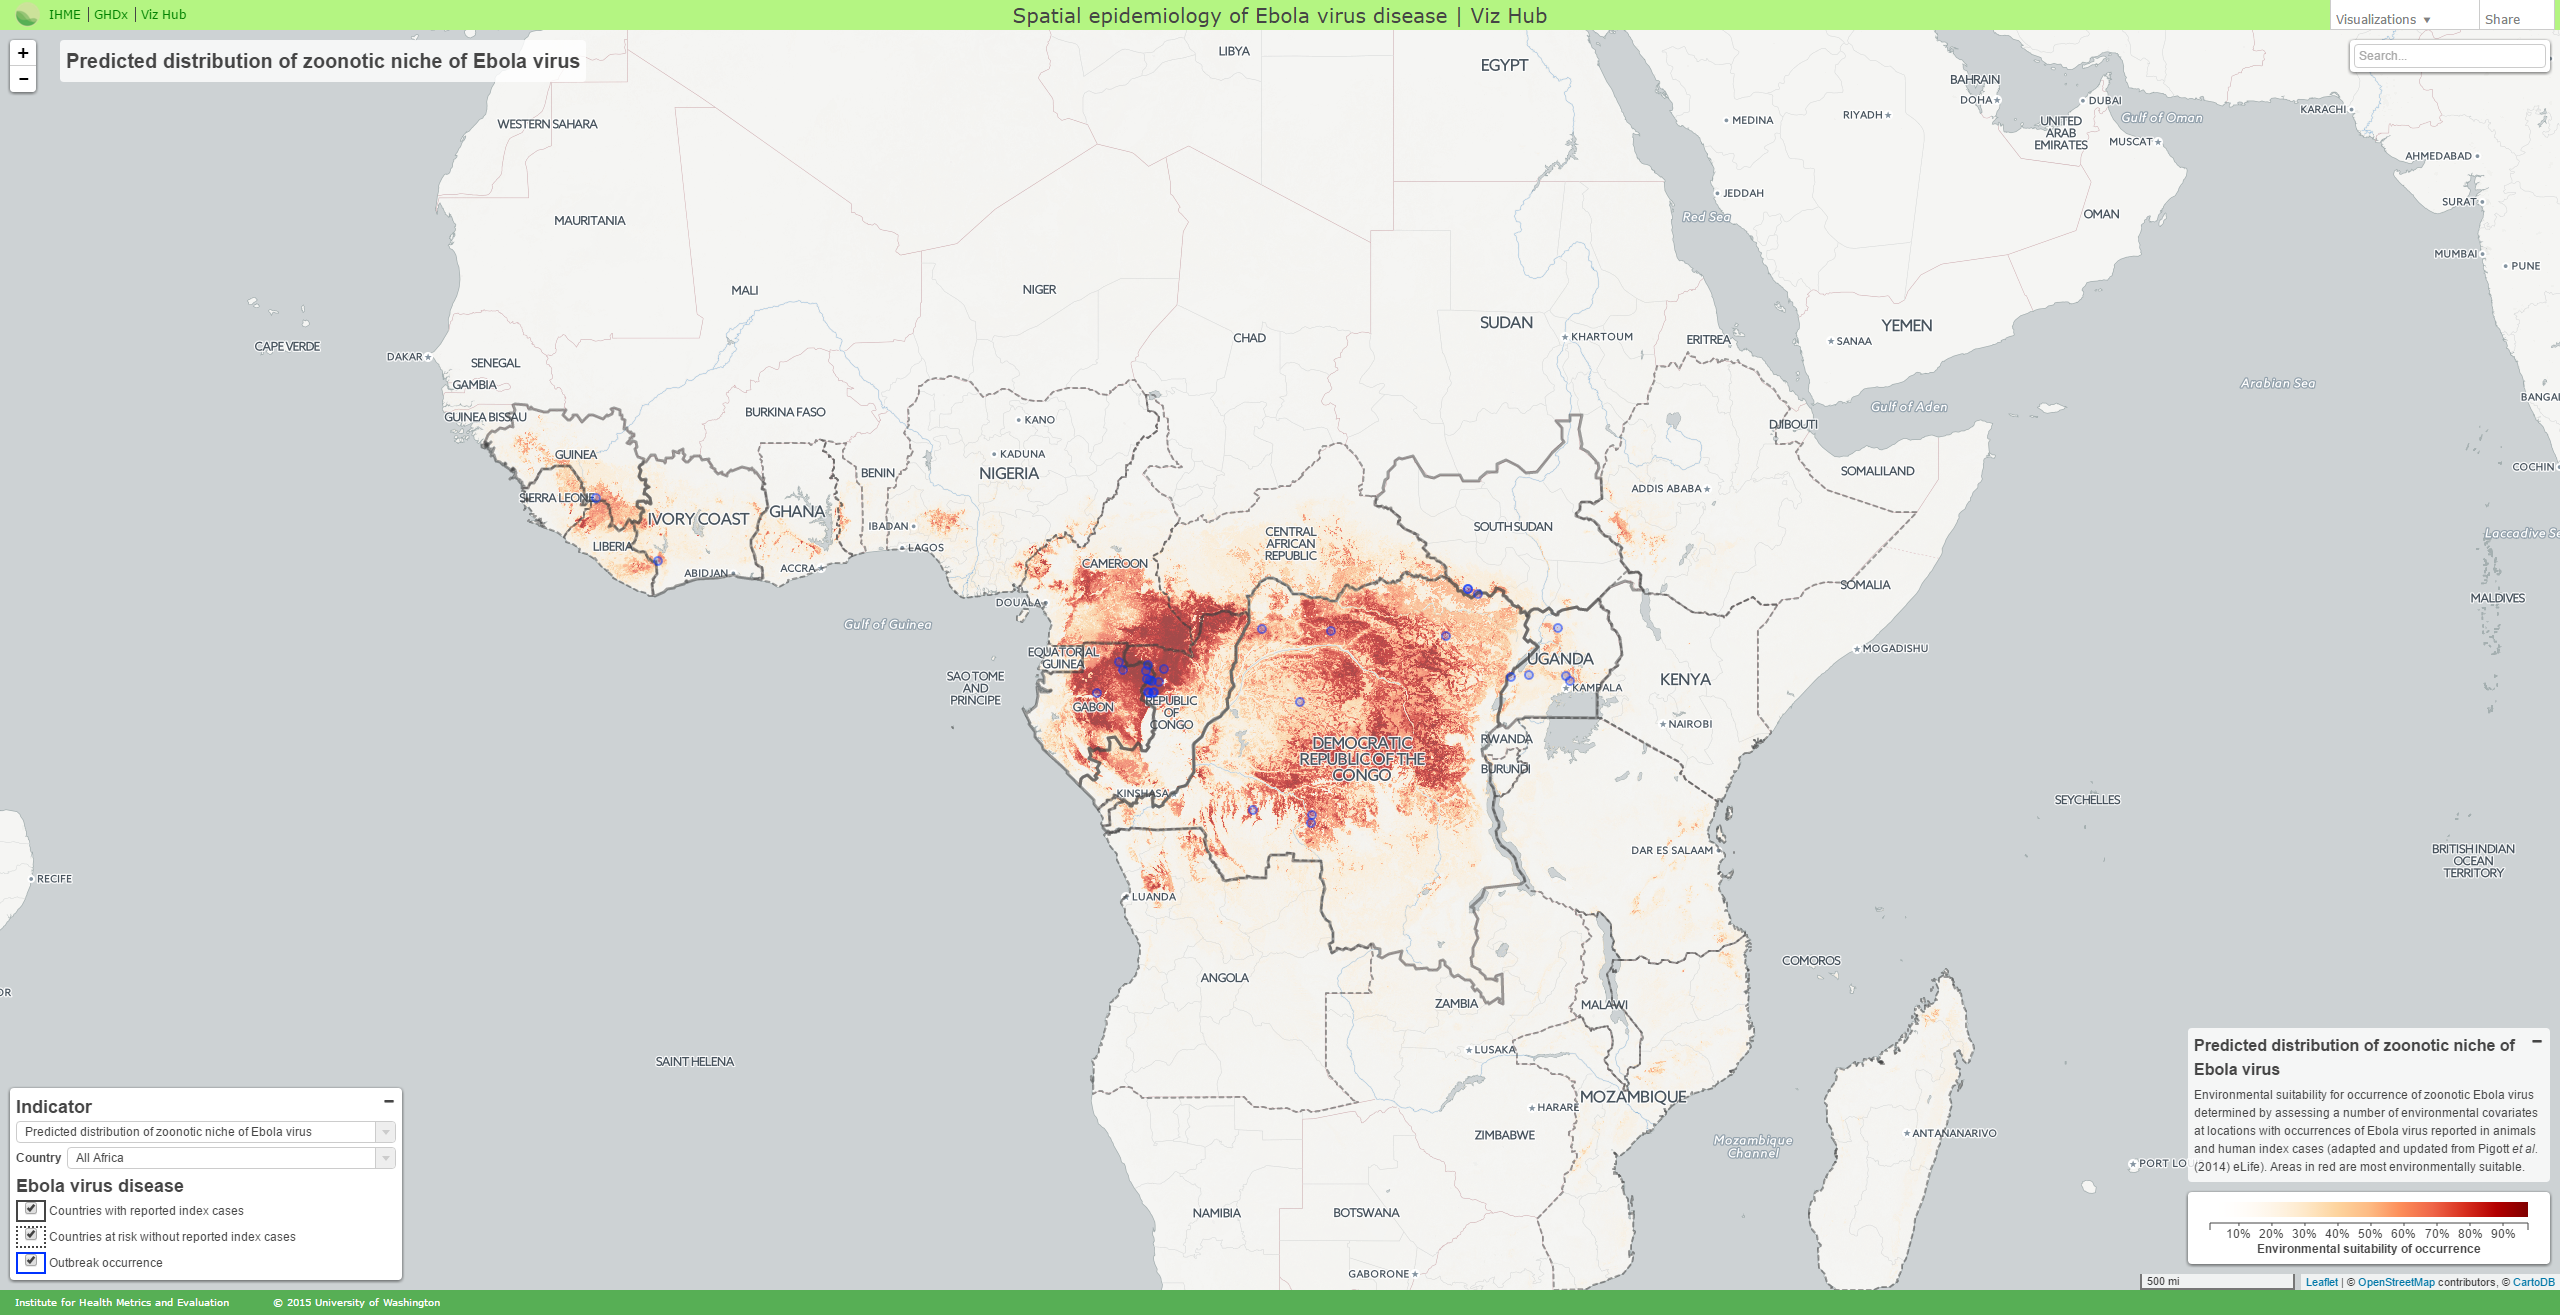
The key output of the Ebola Mapping Tool is identifying areas where future EVD outbreaks could start by estimating areas environmentally suitable for the zoonotic transmission of Ebola. This is done by considering the location of reported outbreaks of Ebola compared to a number of environmental datasets, including the likely habitats of a variety of bat species. The tool presents the zoonotic niches, along with maps showing the likely bat habitats. This tool will help veterinarians and others in charge of disease surveillance, as they can use the maps to guide surveillance within humans, bat species, and other susceptible mammal species.
The Ebola Mapping Tool also maps Ebola index case data points across Africa where EVD was transmitted from a bat or primate to a human. These index cases are important because Ebola response teams need to be able to visit these locations and retrieve additional information for future planning and prevention.
Last, in order to create a complete picture of the potential risk of EVD in Africa, predicted influential social factors were investigated, including population density, travel time from nearest major settlement, measures of health system coping capacity, and vulnerability of populations to understand the risk of local and widespread outbreaks. With increased population and ease of travel and movement, understanding the potential spread of a disease within a country and across borders is essential to planning – especially in West Africa, where high connectivity due to close borders increases the chances of spillover to neighboring countries. Equally important is the distance people have to travel to receive treatment. This is exemplified by the experience of Sierra Leone, a country that suffered a widespread outbreak resulting in almost 4,000 deaths.
“When Ebola started in Sierra Leone, the only place we had a hospital or testing center was in Kailahun district,” explained Dr. Jalloh Abdul, Director of Medical Research Center (MRC) and recipient of the Clinton Global Citizen Award for MRC's work in the Ebola Response. “If you take into account the road conditions and where Kailahun district is located it is sentencing you to death to send you there. One of my ambulances in charge of taking people to the hospital in Kylono district would have five people and arrive with only one alive. Sometimes all of them already dead.”
These maps have the power to illustrate the scale of public health problems in an immediately understandable way, making them important tools for communication and advocacy.
Putting the tool to the test
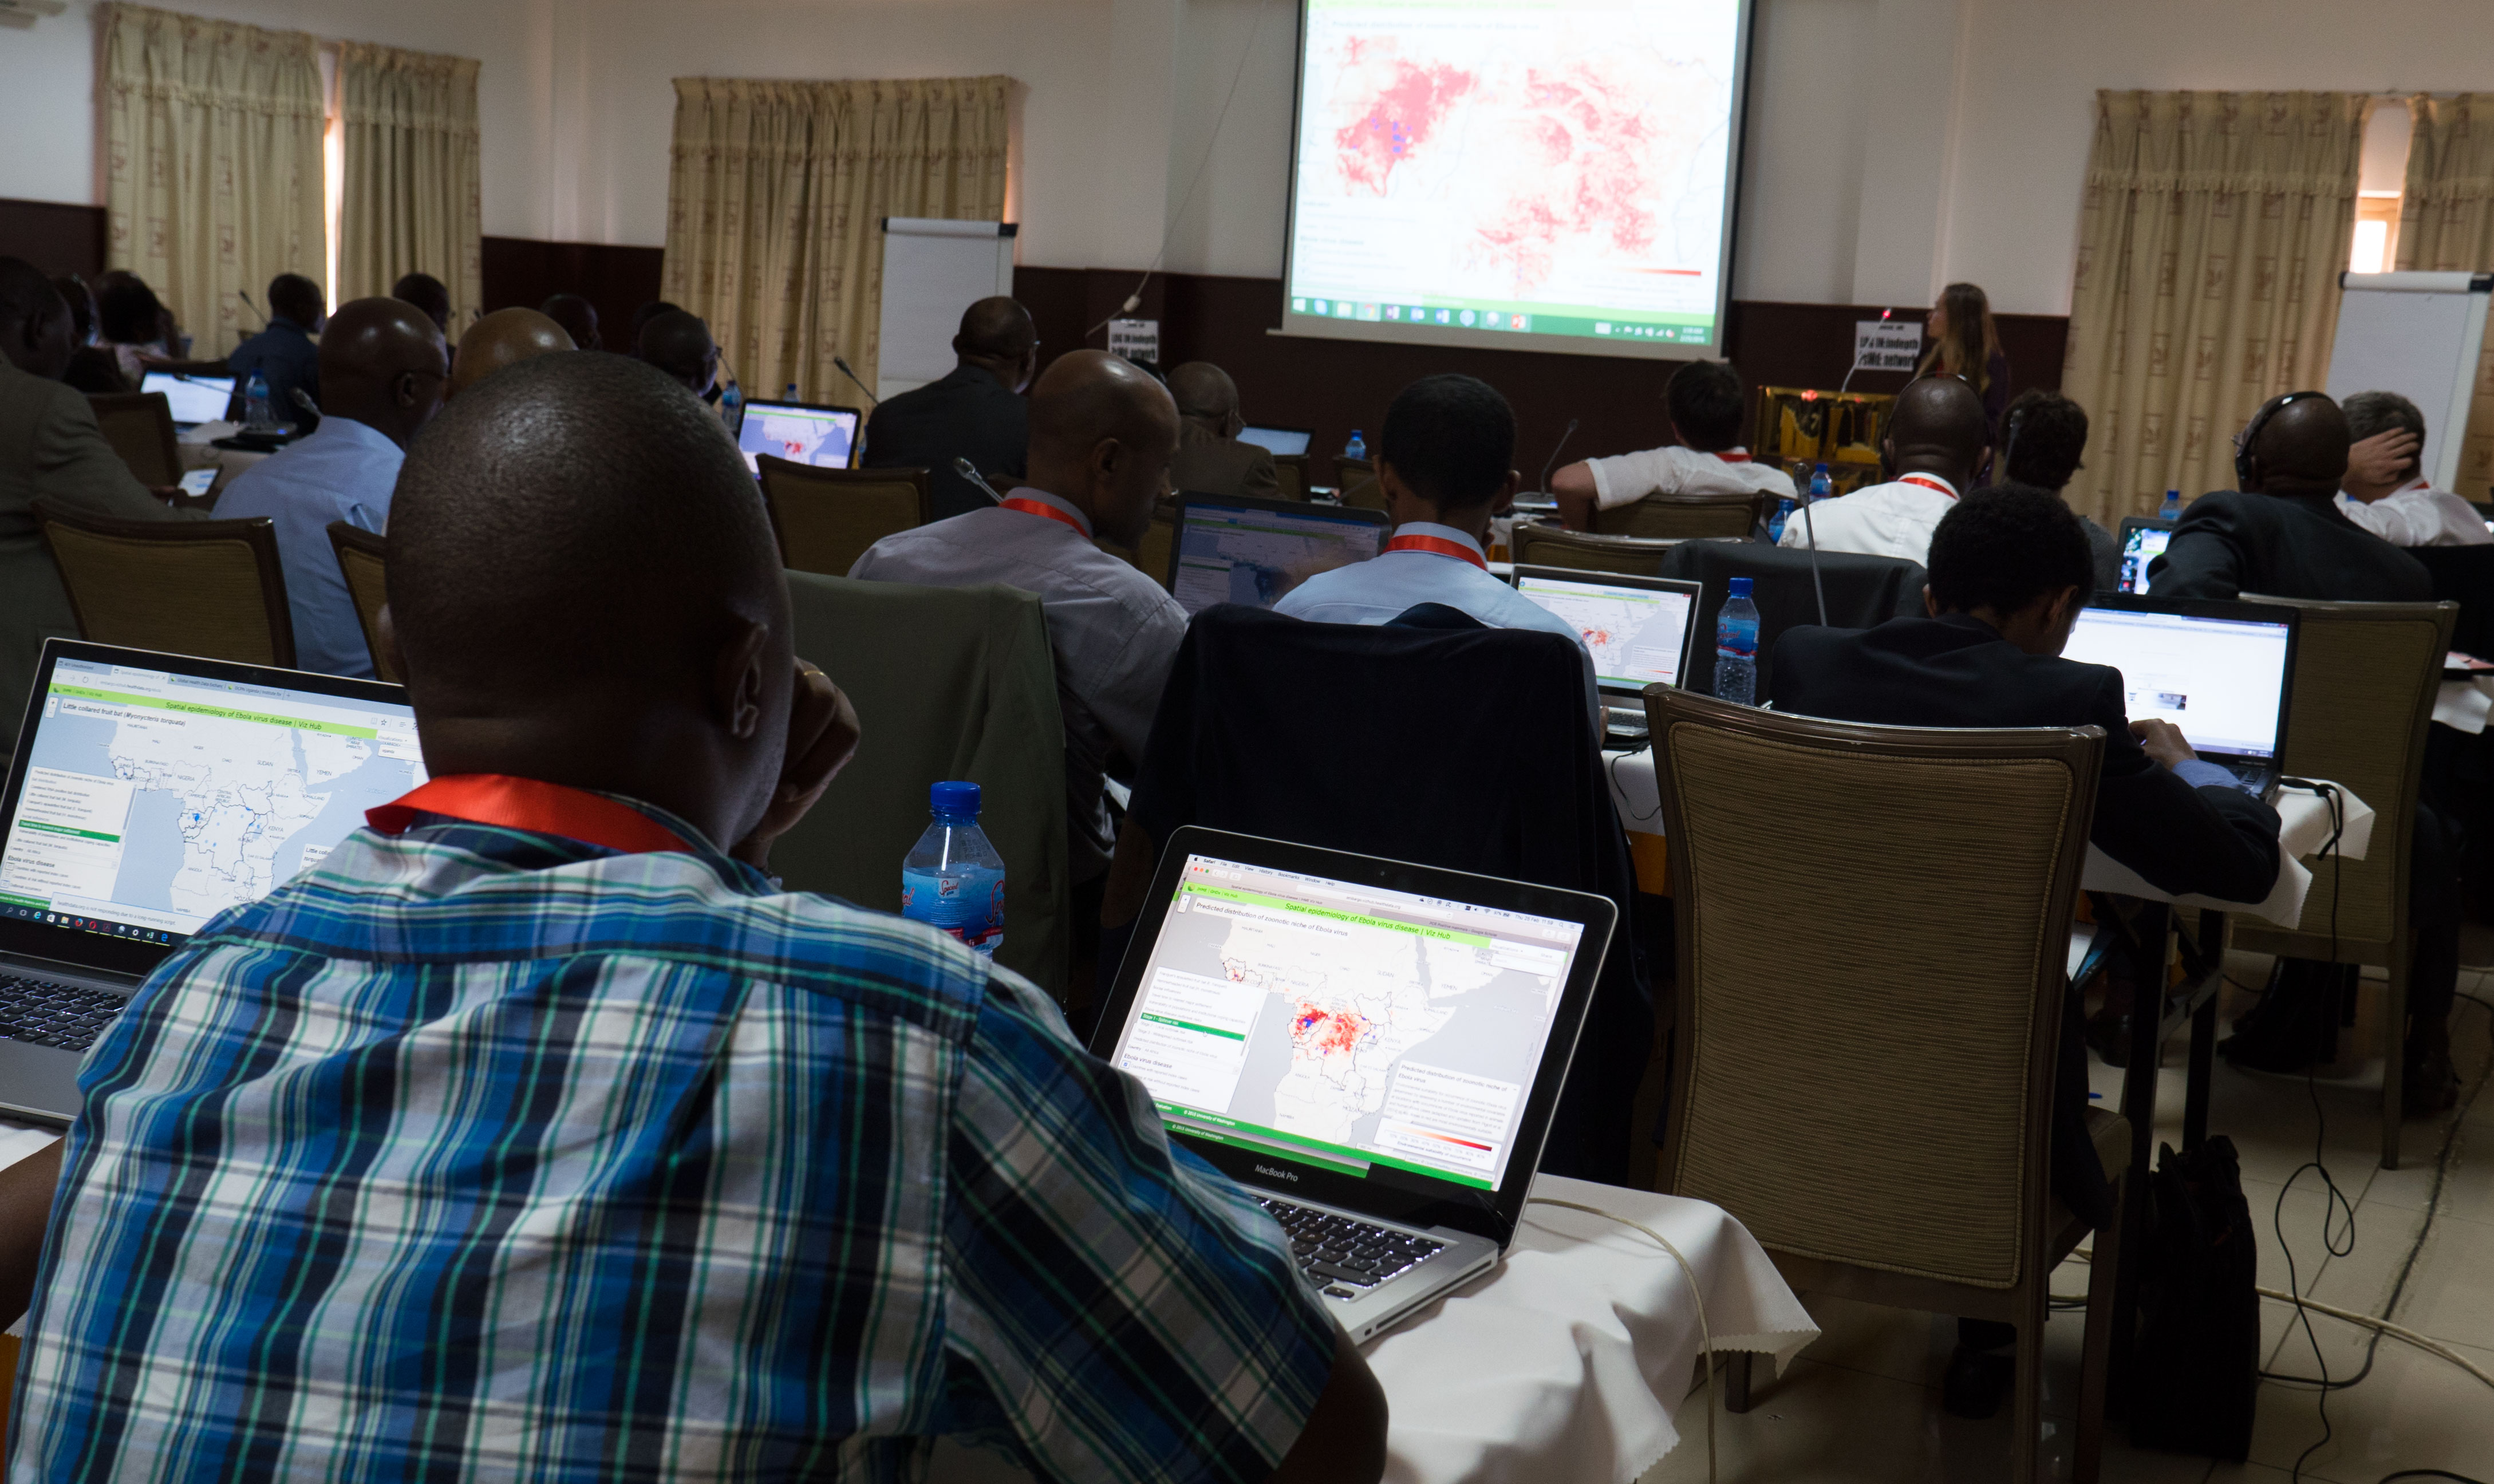
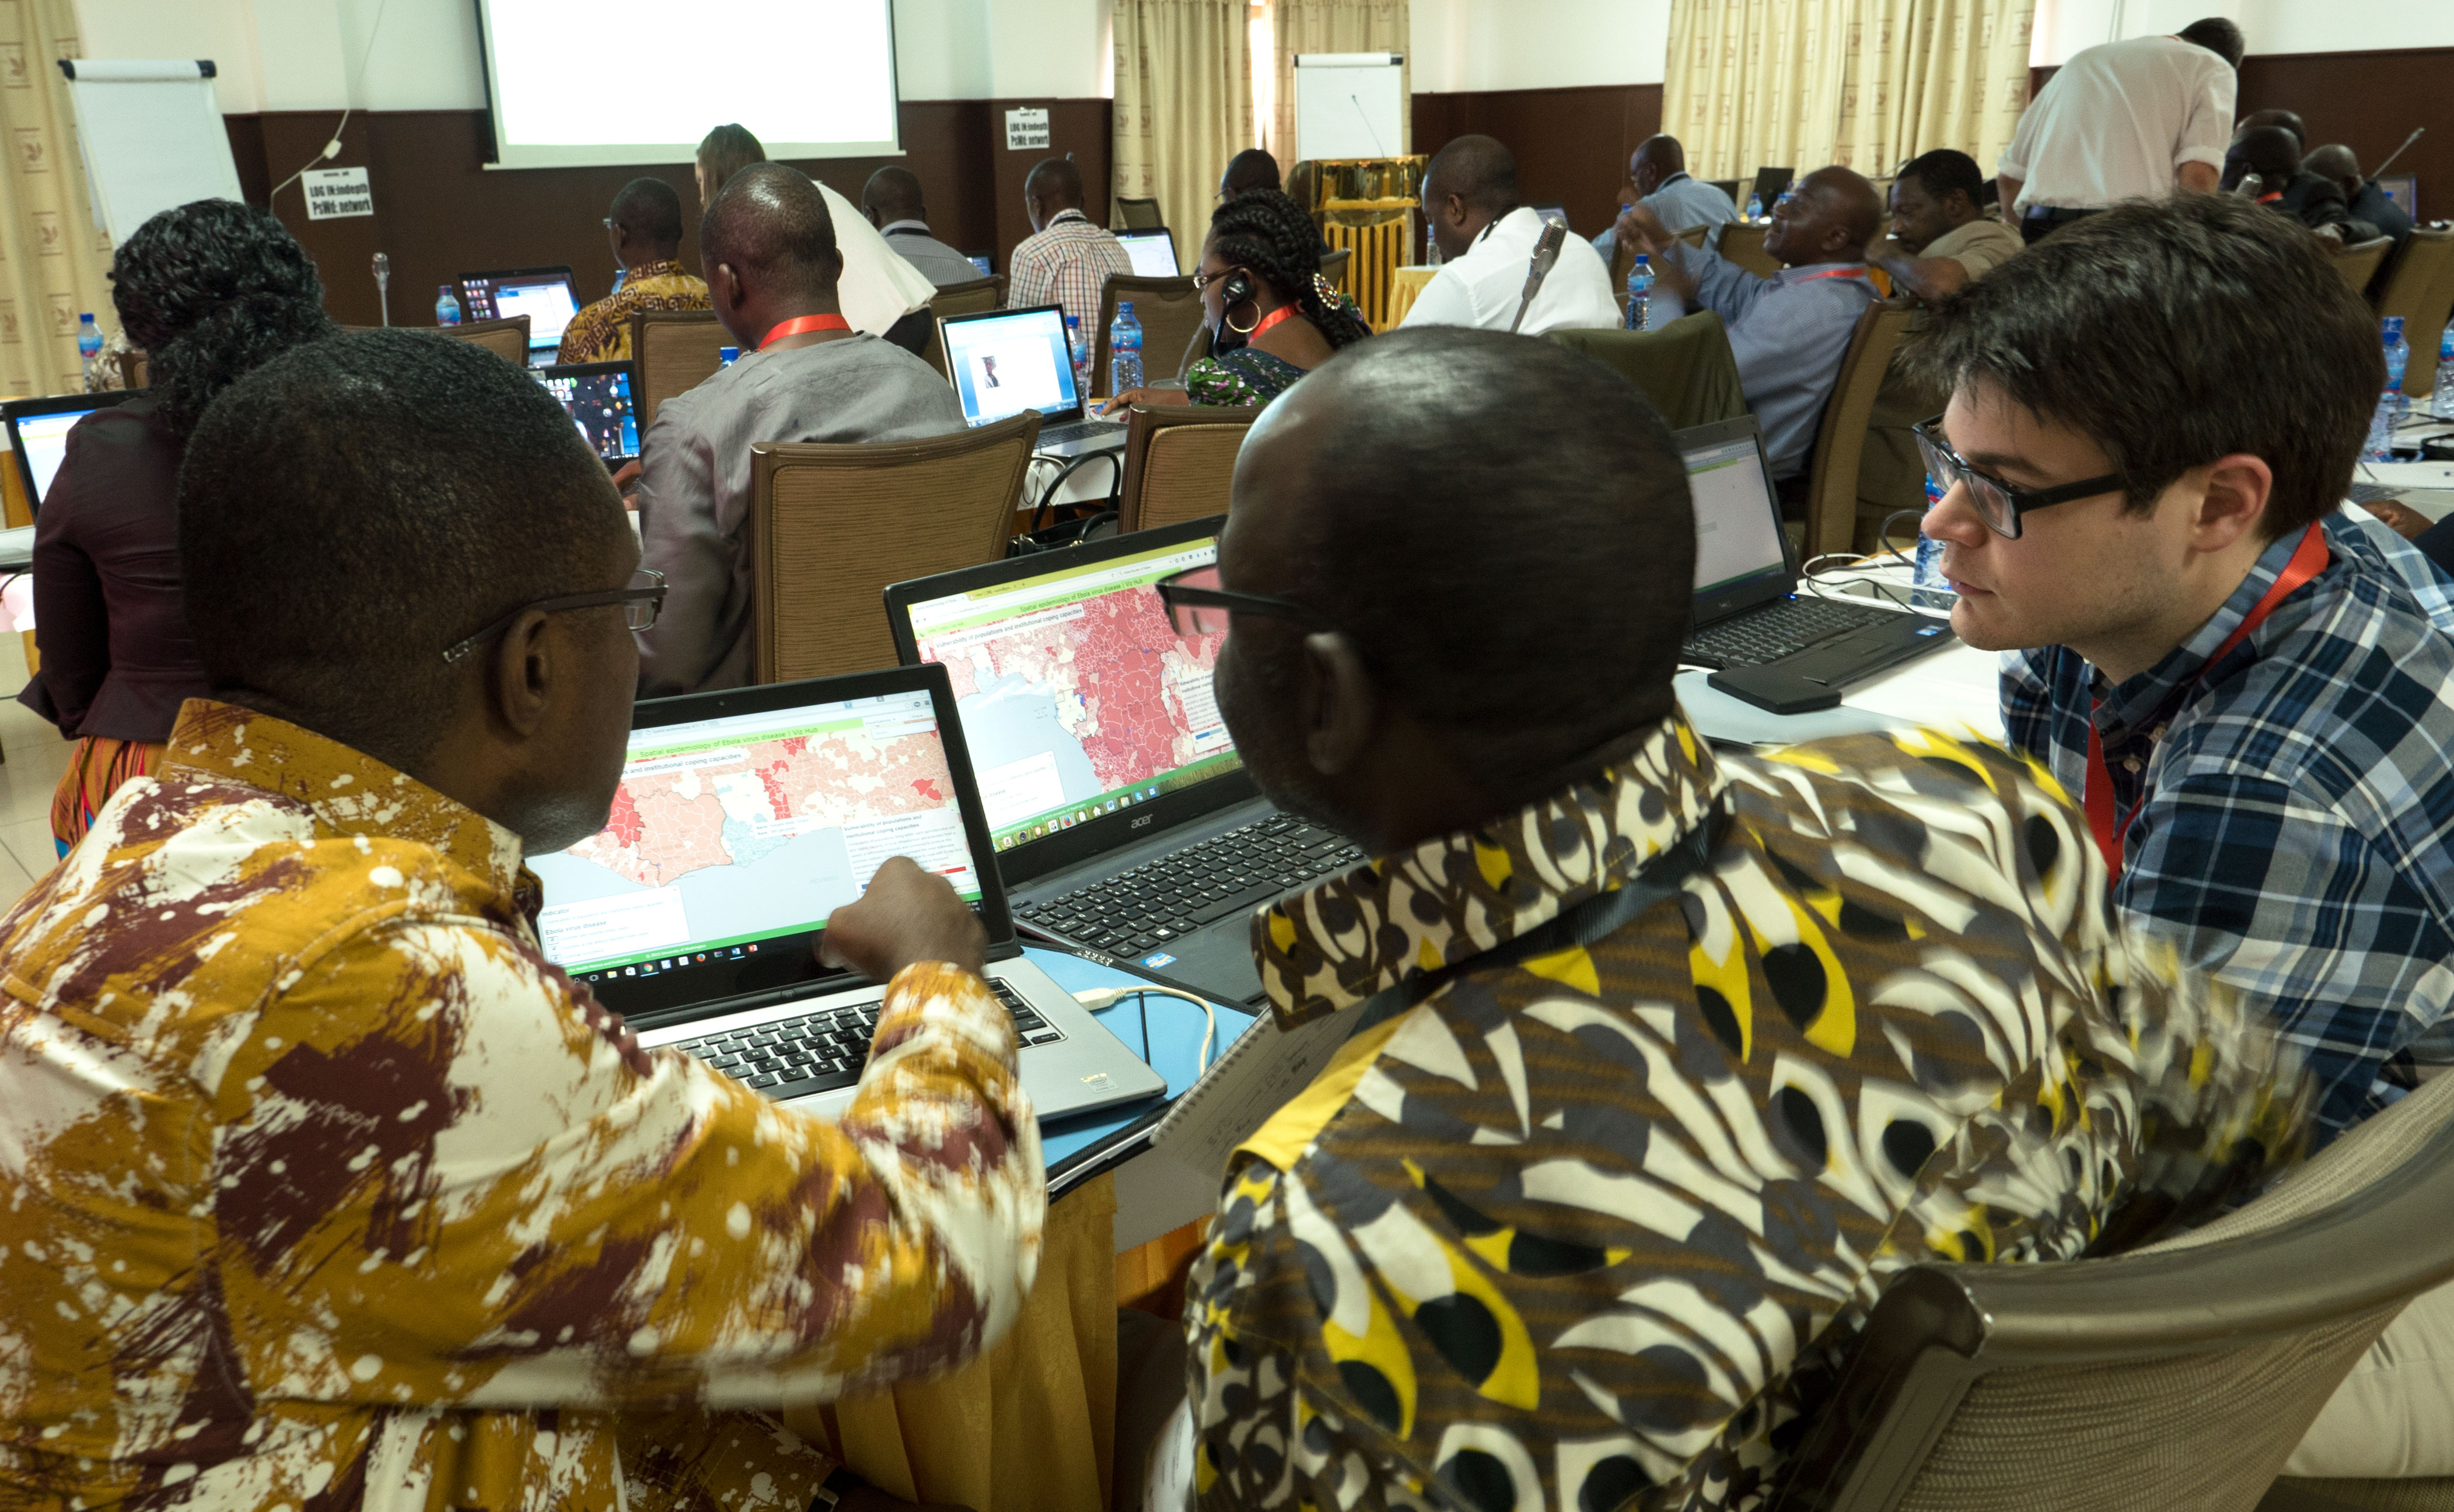
In order to put the Ebola Mapping Tool to the test and receive feedback to make it most useful to end users, the Institute for Health Metrics and Evaluation, in partnership with INDEPTH Network, hosted an Ebola workshop in February in Accra, Ghana, funded by the Paul Allen Family Foundation. This first-ever continental meeting of its kind drew approximately 60 participants, including veterinarians, epidemiologists, researchers, and medical officers from 19 countries considered at risk of an Ebola virus disease index case occurring.
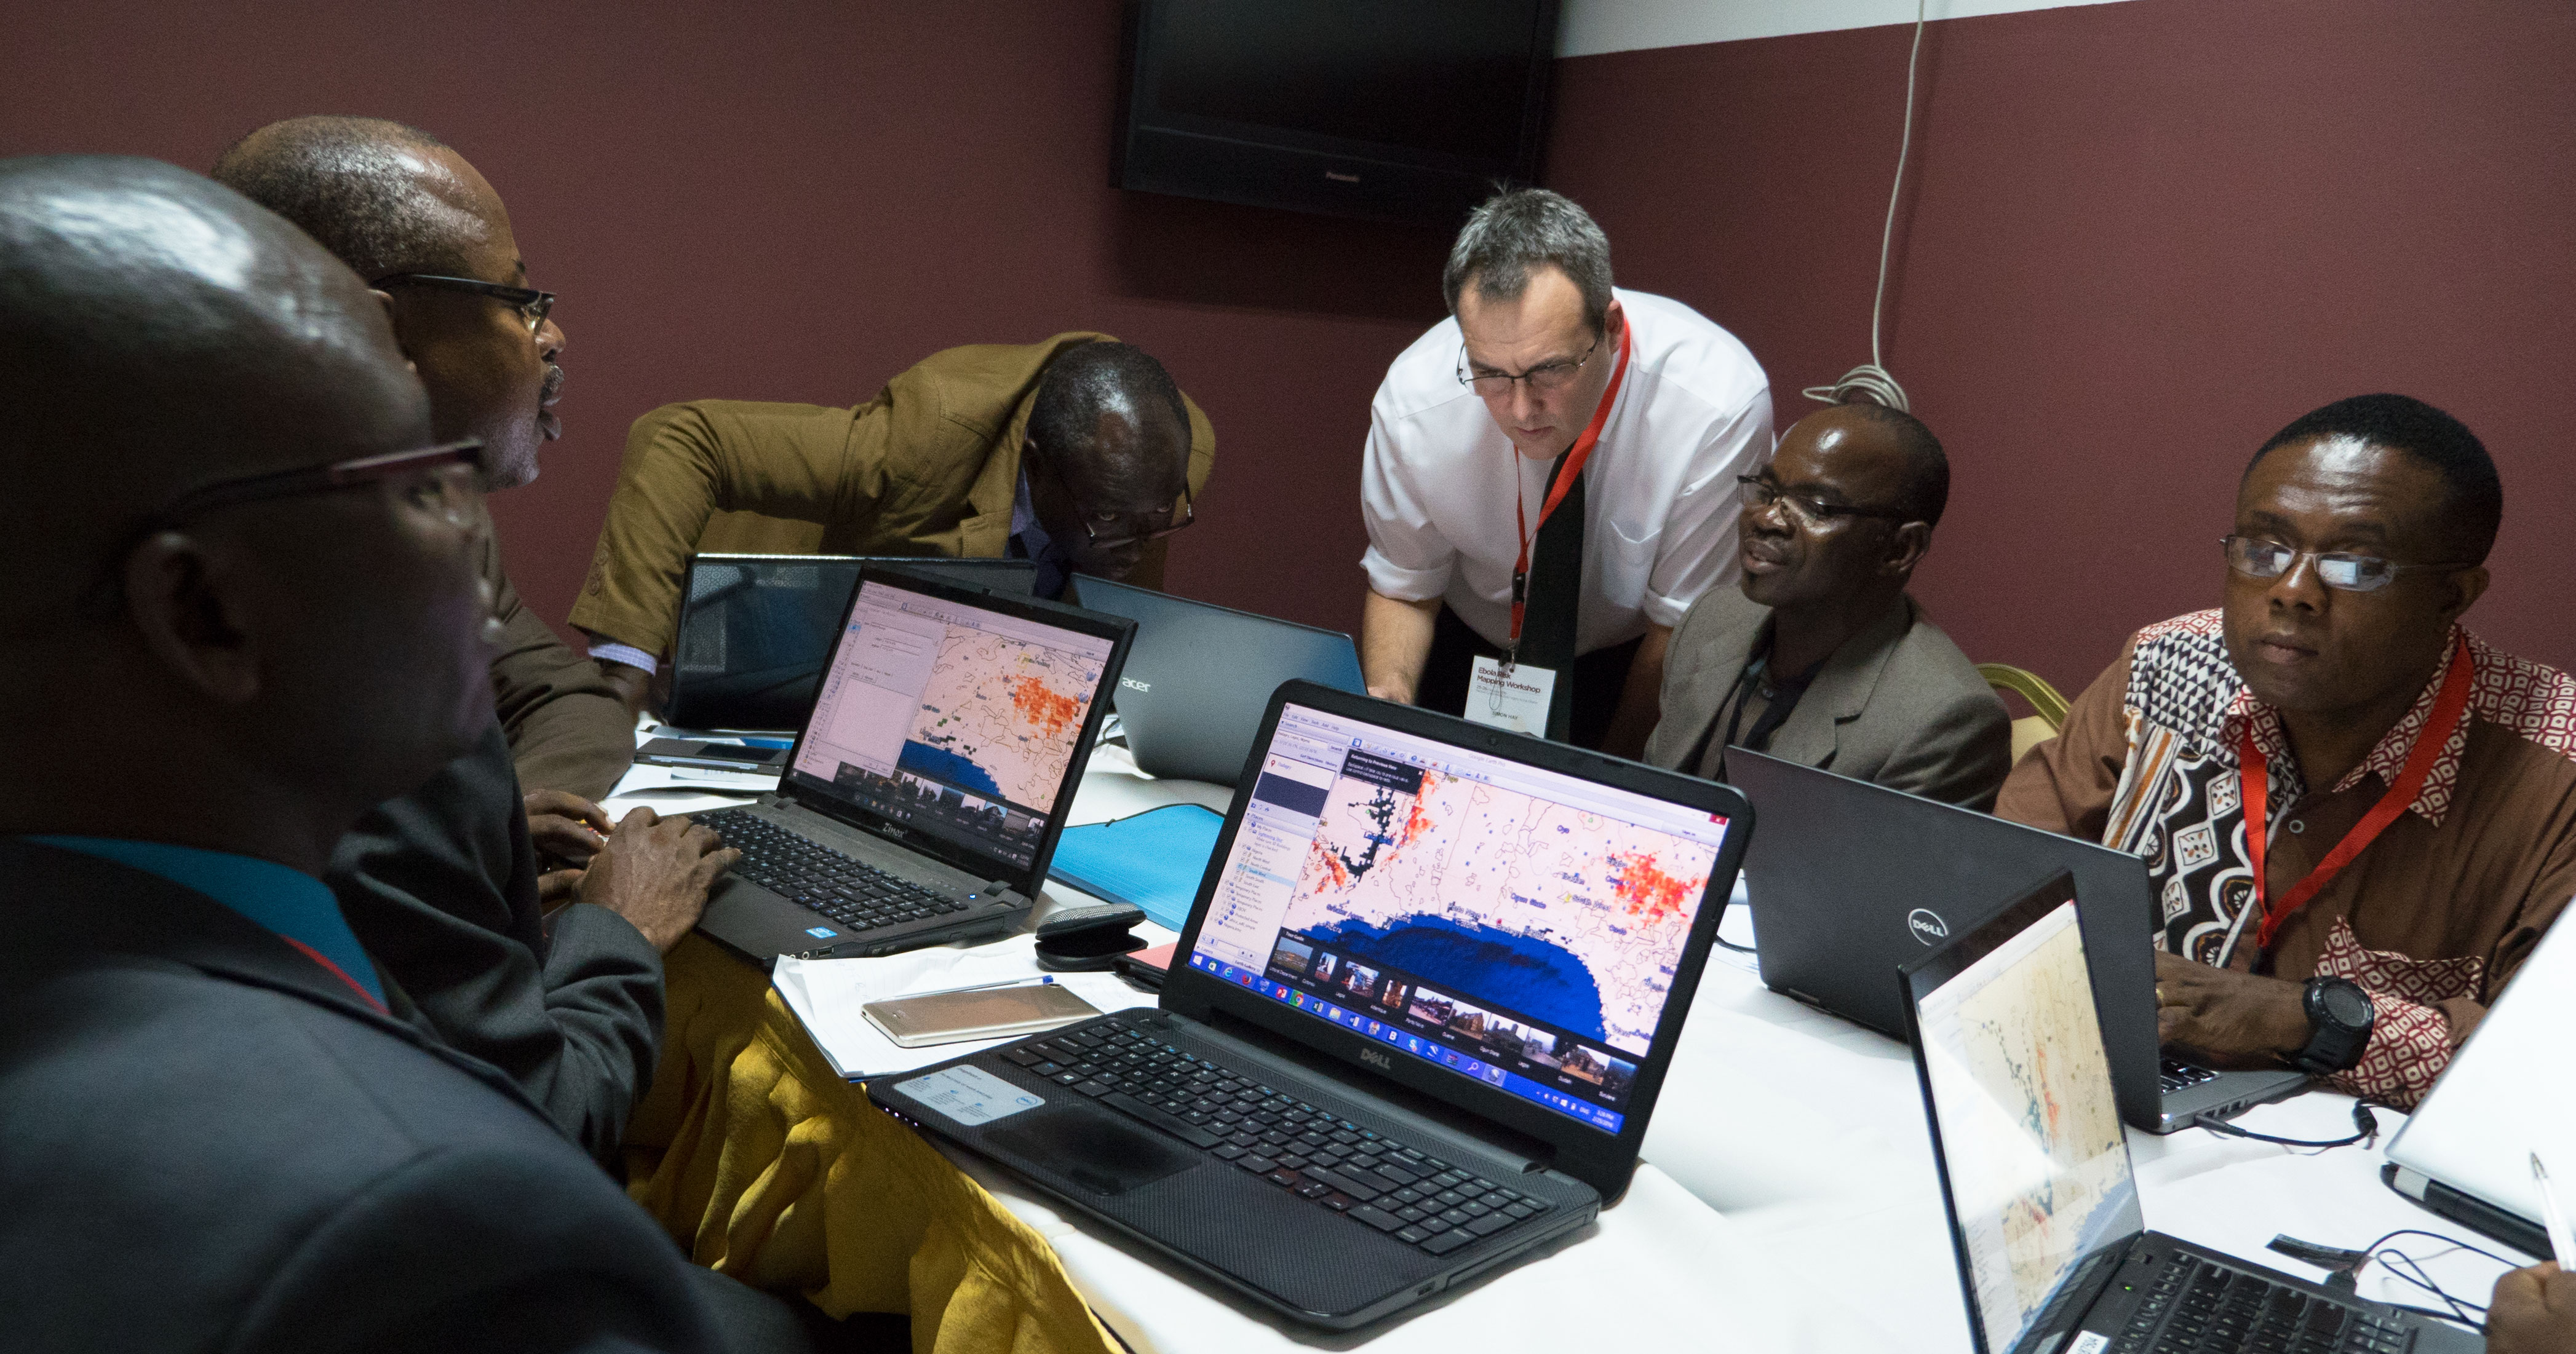 During the meeting, IHME presented research on the geographical distribution of the zoonotic niche for Ebola virus in Africa and explained to key stakeholders how to use our interactive maps to locate areas within their countries at risk of zoonotic spillover (when Ebola moves from an animal host to a human host). Participants used Google Earth and our tool to identify areas to sample bat populations for EVD. Most important, participants had the opportunity to discuss preparedness planning to improve early detection and effective response to Ebola virus disease in their country.
In attendance was Dr. Luke Nyakarahuka, an epidemiologist at Uganda Virus Research Institute who is helping to map surveillance sites for the Ministry of Health in Uganda.
“If the map had come earlier we would have been able to go to these areas where the outbreaks happened and would have educated health workers. Because most of these places where the outbreak happened have been predicted by the map, so that means health workers would have been able to detect this disease early enough before it infected very many people. With a map it makes your health education easier,” said Dr. Nyakarahuka.
 Also in attendance was Dr. Richard Suu-Ire, Head of the Wildlife Veterinary Unit for Ghana and responsible for collecting bat samples for Ebola surveillance in Ghana.
“A lot of the work we are doing, especially in Ghana, involves going into the forest and taking samples,” Dr. Suu-Ire said. “Being a member of the Ebola response team in disease surveillance, I’m looking at how we can re-channel our efforts. I can easily go through the maps and see specifically the districts in Ghana where the niche of Ebola virus is, where is there likely going to be an outbreak, and then from there we can do the animal surveillance. These are the areas I am going to use and I’m going to take it back to the surveillance team, the response team, the national Ebola response committee.”
Dr. Yahya Disu, Medical Officer of Health in Nigeria and National President of the Association of Medical Officers of Health, Nigeria, shed light on the use of interactive maps for decision-making.
“I found this workshop very useful because the tools will enhance my work in coordination and translating data into information for policymakers who will eventually put resources in priority areas. I also plan to cascade this to my colleagues who do what I do and the Ministry of Health. It’s important for them to know this is a useful tool and the government needs to invest in making sure more people know about this tool, how to use it and understand what it means,” said Dr. Yahya Disu.
We have made amazing strides in the fight against many diseases. However, identification of the most marginalized and vulnerable populations is often masked by analysis at a national level. High spatial resolution data are urgently needed to address these inequities and identify where interventions will have the greatest impact to continue to make progress on the world’s most important health problems.
IHME will soon release a publicly available version of the Ebola map and plans to expand our work to other zoonoses with pandemic potential.