
A new way of measuring development helps assess health system performance
Published March 28, 2017
During his recent visit to IHME’s offices, I sat down with Dr. Yohannes Kinfu, member of the Global Burden of Disease (GBD) study’s Scientific Council and the person who came up with the idea that led to the creation of the Socio-demographic Index (SDI), a new metric for measuring development. SDI is an integral part of the GBD study and made its debut in the most recent GBD update that was published in October 2016. SDI allows people to compare countries’ health outcomes and the performance of health systems, and better understand what tomorrow’s health landscape will look like.
Trained as an economist and demographer, Dr. Kinfu is a Senior Research Fellow at the University of Canberra Health Research Institute in Australia. In this interview, Dr. Kinfu explains the reasons he created the new metric, and how it can be useful to researchers and policymakers alike.
Q: How did you first became involved in the Global Burden of Disease study?
My interest in GBD started when I was working at WHO in the Department of Health Information Systems, where I produced annual health statistics and mortality estimates.
I also worked at the University of Queensland with [GBD co-founder] Alan Lopez. My direct involvement in the study started after attending my first GBD workshop in 2014.
Q: How did you come up with the idea that led to the creation of the SDI metric?
I wanted an indicator that was easy to understand and interpret, and could measure changes over time in development status. This new metric allows you to look at a particular country and see what progress or lack of progress it has made.
SDI actually captures three different but important aspects of development: income, education, and fertility.
The method is also comparable to the Human Development Index (HDI), but taking health out of the equation (it’s part of HDI) makes comparison easier when you are comparing different health outcomes. Scientifically speaking, health shouldn’t be used in an index if you want to compare health metrics across countries.
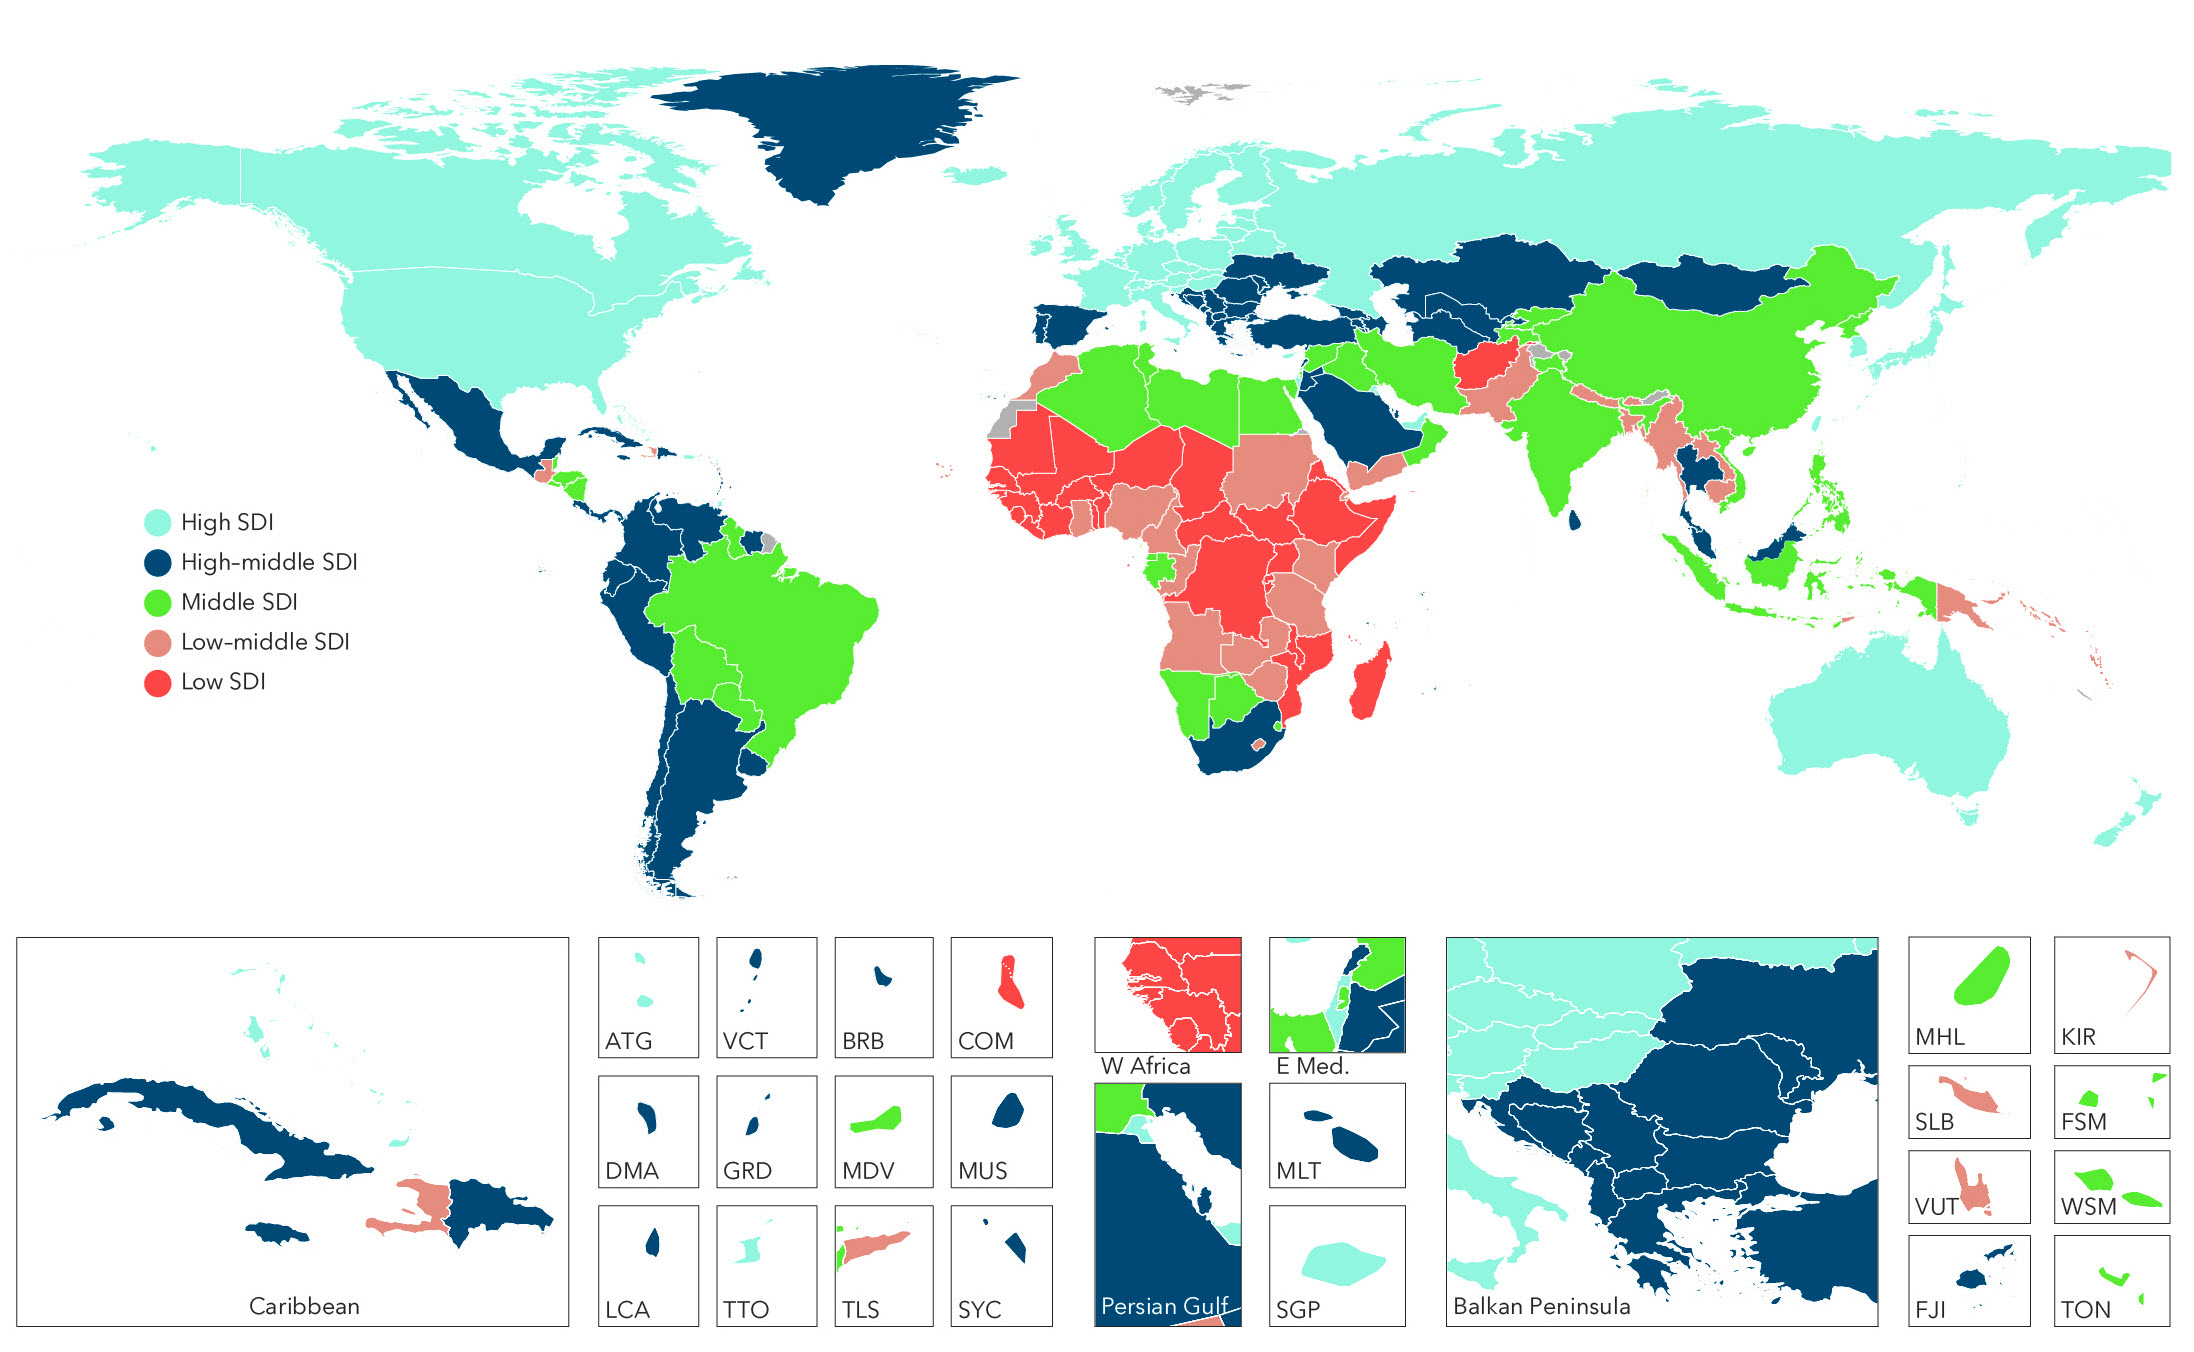
Sociodemographic-Index groupings by country
Q: What are advantages over other commonly used measurements of development, such as income groupings?
SDI captures more than just income. For example, it helps us understand access to quality reproductive care and women’s autonomy and education.
Also, SDI is highly correlated with many of the health outcomes that GBD reports, which makes it easier to predict health outcomes. For example, fertility captures differences in the number of people in different age groups in a country, which is in turn linked with mortality patterns. In a country with a large number of older people, for example, more people die than in a country with greater numbers of young people.
Q: What should decision-makers do with SDI?
SDI can be used to track progress in key areas of socioeconomic development and monitor inequalities across nations and areas within nations.
Government agencies can easily calculate it themselves – it’s easy to get the different indicators. For example, within a country where there are wide inequalities in SDI, we should also expect wide variation in patterns of disease burden. Such information will allow government agencies and other stakeholders to predict health outcomes and identify areas that need additional support. On the other hand, researchers can use the index as a control variable when examining the impact of health systems on health outcomes and health outputs.
Q: Were there any surprising findings when you got the results?
The findings make sense – countries that came high on the list were countries that had better health outcomes and better well-being. For example, countries such as Norway, Canada, the US, and Switzerland had the highest SDI, while countries suffering from limited socioeconomic progress (such as Burkina Faso, Mali, and Guinea) and those emerging out of civil conflicts (such as Somalia, South Sudan, Liberia, and Afghanistan) dominate the low end of the SDI. Clearly, efforts to increase income, provide more years of education, and support family planning can catalyze gains in life expectancy and healthy life expectancy (the number of years a person can expect to live in full health), and reduce disease burden.
Despite these general trends, we found that some countries at the same level of development were doing much better than their peers, while others were doing worse than expected. In 2005, 115 countries and territories experienced total disease burden that was lower than expected given their SDI.
For example, rates of disease burden were lower than expected based on SDI in many countries throughout Latin America, Western Europe (e.g., Portugal, Spain, France, Italy, and Sweden); Western sub-Saharan Africa (e.g., Burkina Faso, Niger, and Senegal); Eastern sub-Saharan Africa (e.g., Burundi and Ethiopia); North Africa and the Middle East (e.g., Jordan, Saudi Arabia, and Turkey); East Asia (e.g., China); and a subset of countries in South and Southeast Asia (e.g., Bangladesh, Sri Lanka, and Vietnam).
On the other hand, the US, countries in Southern sub-Saharan Africa, much of Central Asia and Eastern Europe, and a number of countries in Central sub-Saharan Africa had levels of disease burden that were much higher than expected based on SDI.
These findings underscore how SDI can be used to monitor health system performance, and/or to understand how much disease burden countries could prevent.