
Estimation of total and excess mortality due to COVID-19
Published October 15, 2021
This page was updated on October 15, 2021 to reflect changes in our modeling strategy. View our previous methods published May 13, 2021 here.
In our October 15 release, we introduced three major changes. First, we have very substantially updated the data and methods used to estimate excess mortality related to the pandemic. Second, we are now estimating the fraction of excess mortality in each country that is directly related to COVID-19 and the fraction that is increased mortality in individuals who were not PCR-positive at the time of death. Third, the estimation of past infection triangulating on cases, hospitalizations, deaths, and the infection-detection rate, infection-hospitalization rate, and infection-fatality rate has been revised to capture multiple sources of uncertainty. Below, we provide more detail on these revisions.
In addition to the methods changes, we have also made a change in the indicators we report. We now show in our tools and briefs reported and total COVID-19 deaths, while previously we were showing reported and excess.
1. Revisions to estimating excess mortality. For this analysis, countries can be divided into two groups: a) countries that have reported monthly or weekly deaths due to all causes before and during the pandemic, and b) countries that have not reported deaths during the pandemic. Most countries are in group b.
As previously described, we provide estimates of excess mortality for countries that report all-cause mortality data which are based on an ensemble of six different models. These six models are weighted by their root mean squared errors from an out-of-sample predictive validity test. As in our previous analysis, late registration is evaluated by comparing successive releases of weekly or monthly all-cause mortality data. The more recent weeks/months where reported all-cause mortality is less than 99% complete were excluded from our analysis. In addition, we also included provincial-level excess mortality rate estimates provided by the Medical Research Council of South Africa and excess mortality based on reported deaths in the civil registration system for periods during the first and second waves of COVID-19 from nine states in India. Inclusion of civil registration data for these states in India very substantially increases estimates of excess mortality for India, particularly during the Delta variant surge. In total, we have data for 163 countries and 220 states/provinces within countries.
To predict excess mortality for all locations without directly measured all-cause mortality, we evaluated the relationship between the excess mortality rate and a list of COVID-19-related covariates such as infection-detection rate and covariates suggested by meta-analysis conducted by the US Centers for Disease Control and Prevention. To arrive at a parsimonious model with covariates with sensible direction of effect on excess mortality rate, we run our model using Least Absolute Shrinkage and Selection Operator (LASSO) regression to help identify covariates to be included in our analysis. Through our model selection process, the list of covariates included are:
- Cumulative seroprevalence (lagged)
- Mobility (lagged)
- Infection-detection rate (lagged)
- Reported COVID-19 mortality rate
- Crude death rate
- Prevalence of diabetes
- Prevalence of smoking
- HIV death rate
- Inpatient admission rate
- Quality of death registration
- Average latitude
- Proportion of population over age 75
- Prevalence of hypertension
- Healthcare Access and Quality Index
To account for uncertainty in both directly estimated excess mortality based on registered deaths and the selected covariates, we run our estimation 100 times based on draw-level excess mortality and draw-level covariates. We use the draw-level residuals not explained by the fixed effects of the selected covariates in making predictions for locations with all-cause mortality to match the observed data. Regional and super-region-level residuals are generated as the mean of locations included in those aggregated location hierarchies. Given the diverse and incomplete time period covered by the civil registration data from India, the average of state-level residuals is used for all states in India.
We predict excess mortality from March 1, 2020, to September 26, 2021, using 100 draws of covariates for this cumulative period and the draw-level model coefficients and residuals estimated in the previous step. Figure 1 shows the estimated excess mortality rate (deaths per 100,000) for the aforementioned time period.
Figure 1: Estimated excess mortality rate (deaths per 100,000) from March 1, 2020, to September 26, 2021
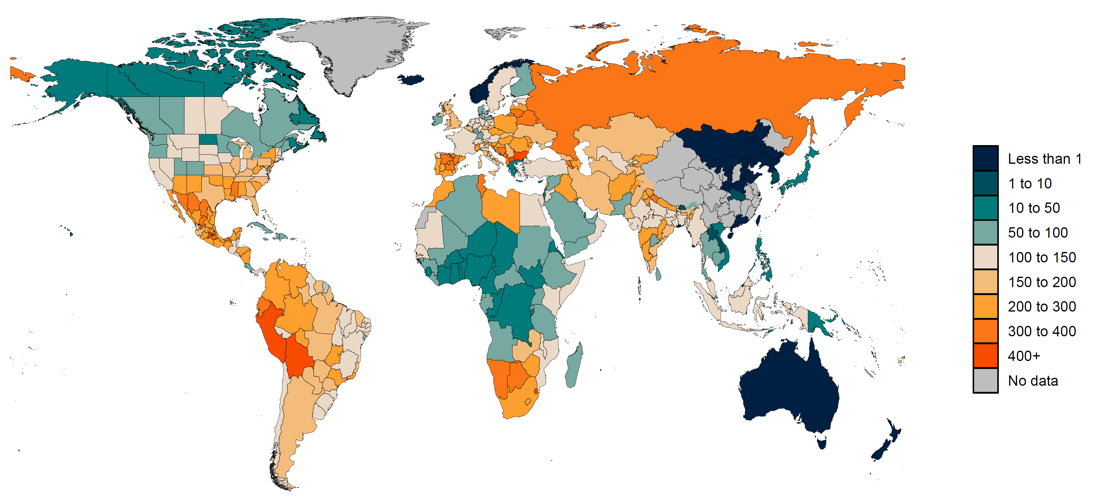
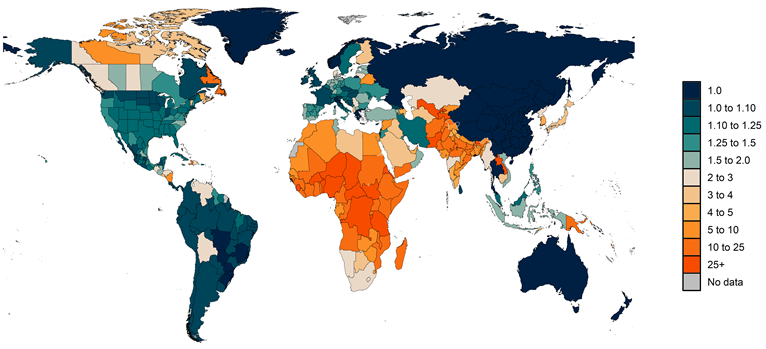
2. Estimating the fraction of excess mortality directly attributable to COVID-19 infection. Estimating the deaths in individuals that occurred when actively infected with COVID-19 is challenging. Some jurisdictions within countries and some countries, such as the Russian Federation, have reported deaths where COVID-19 is reported on the death certificate as the underlying cause of death and, in addition, PCR-positive patients who have another cause of death listed as underlying cause on the death certificate. Following WHO recommendations, we define in principle total COVID-19 deaths as all deaths where the individual was actively infected at the time of death. The number of jurisdictions reporting this sort of detailed data, however, is very limited. We have had to use a statistical estimation approach to approximate the fraction of excess deaths that are total COVID-19 deaths. In particular, we use the regression analysis for excess mortality and compute a counterfactual level of excess mortality where the infection-detection rate is set to the observed maximum level and set mobility to the pre-COVID-19 baseline. These are meant to correct excess mortality for changes due to under-reporting and changes in behavior such as care-seeking related to mobility. In a given location, if reported COVID-19 deaths are higher than estimated total COVID-19 deaths, we use reported COVID-19 as the estimate of total COVID-19 deaths. Figure 2 shows the ratio of estimated total COVID-19 deaths to reported COVID-19 deaths by location.
Figure 2: Estimated ratio of total COVID-19 deaths to reported COVID-19 deaths from March 1, 2020, to September 26, 2021
3. We have improved how we estimate past COVID-19 infections to better reflect the various sources of uncertainty that impact that estimation process. This includes the following changes which were introduced in this week’s release:
- We have implemented an ensemble model for our infection-fatality rate and infection-hospitalization rate models that uses the 100 most predictive combinations of the following covariates (in addition to time). These covariates were based on a US CDC meta-analysis of factors related to COVID-19 infection.
- Obesity prevalence
- Cardiovascular disease prevalence
- Cancer prevalence
- Chronic kidney disease prevalence
- Diabetes prevalence
- Chronic obstructive pulmonary disease prevalence
- Smoking prevalence
- Universal health care coverage
- Healthcare Access and Quality Index
- We also used an ensemble model for infection-detection rate based on the following covariates (one used in each model, along with testing capacity):
- Universal health care coverage
- Healthcare Access and Quality Index
- Proportion of the population 65 years and older
- We generated 100 samples of each seroprevalence observation based on the reported error in seroprevalence studies, and then created bootstrapped samples from those 100 sets of seroprevalence data to include in each model in the ensemble.
- When correcting seroprevalence studies for under-reporting due to seroreversion, we sampled curves from the assay-specific sensitivity decay functions based on the error reported in those studies rather than using the point estimates only.
- Rather than assuming a single fixed value of cross-variant immunity at 0.5, we sampled from a uniform distribution ranging from 0.3 to 0.7 (as is already done in our Susceptible–Exposed–Infectious–Recovered [SEIR] model).
- Rather than assuming a single fixed value of increased risk of hospitalization and mortality for non-ancestral variants relative to ancestral, we use an estimate found in the literature (https://www.bmj.com/content/372/bmj.n579) of 1.64 (95% CI: 1.32–2.04) – an increase from the previous source we drew from, which reported 1.29.
- When triangulating infections based on cases, deaths, and hospitalizations, we give more weight to one of those three input series in each sub-model to better capture heterogeneity among these data.