
What we measure and why
Published July 10, 2019
After finding data sources; vetting, cleaning, and standardizing these data; and using mathematical models to determine the relationships between millions of data points, the researchers in the Global Burden of Disease study (GBD) can produce the study’s results: its estimates of disease burden.
Those estimates are most often expressed as “metrics,” such as years of life lost (YLLs), years lived with disability (YLDs), and disability-adjusted life years (DALYs), which are familiar to people who frequently use the GBD but can be a confusing set of acronyms for people new to the study. You might wonder why GBD researchers bother to use new and potentially unfamiliar metrics instead of tried-and-true, older ways of discussing disease, like prevalence (existing cases of disease) and incidence (new cases of disease).
In short, GBD metrics improve upon previously established metrics. They help you make comparisons across time, location, illness, age, and sex, answering questions such as:
- What disease, injuries, and risk factors cause the most early death and disability in a given country?
- How does health performance differ across countries?
- When designing an intervention to improve the health of young women, which health problems should be targeted to make the greatest impact?
To illustrate how GBD metrics complement other population health metrics, let’s consider some standard public health metrics, and how GBD-specific metrics build on them.
How long do people live?
The length of time people in a population live is a basic health metric. Calculating the all-cause mortality rate, or the proportion of people within a particular population who died in a given time, is one of the first things that GBD researchers determine during each typically annual update (each “cycle”) of GBD estimation. To do that, they determine the number of deaths within every population in the study (including different sexes, age groups, and locations) each year, and divide that by the size of the population.
A related and familiar metric is life expectancy. GBD uses life expectancy to compare how well different locations are performing. Life expectancy is the number of years the average newborn in a population can expect to live if mortality rates in the current year persist for the rest of a person’s life. Life expectancy usually underestimates how long a newborn will actually live. As a general rule, mortality rates decline over time rather than remaining constant.
The most common life expectancy measure is life expectancy at birth, but life expectancy can be calculated for any age. It might seem odd to calculate life expectancy at each age – after all, isn’t life expectancy just life expectancy? In fact, what most people mean when they say “life expectancy” is “life expectancy at birth” – that is, how many years a newborn can expect to live. But with each year that you live, your life expectancy can change.
Consider an example from Brazil. In 1990, the life expectancy for a 20-year-old female was 56.7, meaning they could expect to live to age 76.7. But in 2017 the life expectancy for that same group of people – females in Brazil, now aged 45 – was 36.9, meaning they could expect to live to age 81.9 – 5.2 years longer.
The reason for this is that life expectancy serves as a snapshot of population health at a particular point in time. Between 1990 and 2017, health in Brazil improved – the country became richer, medical practices improved, more people obtained access to medical care, and so on – and life expectancy rose accordingly.
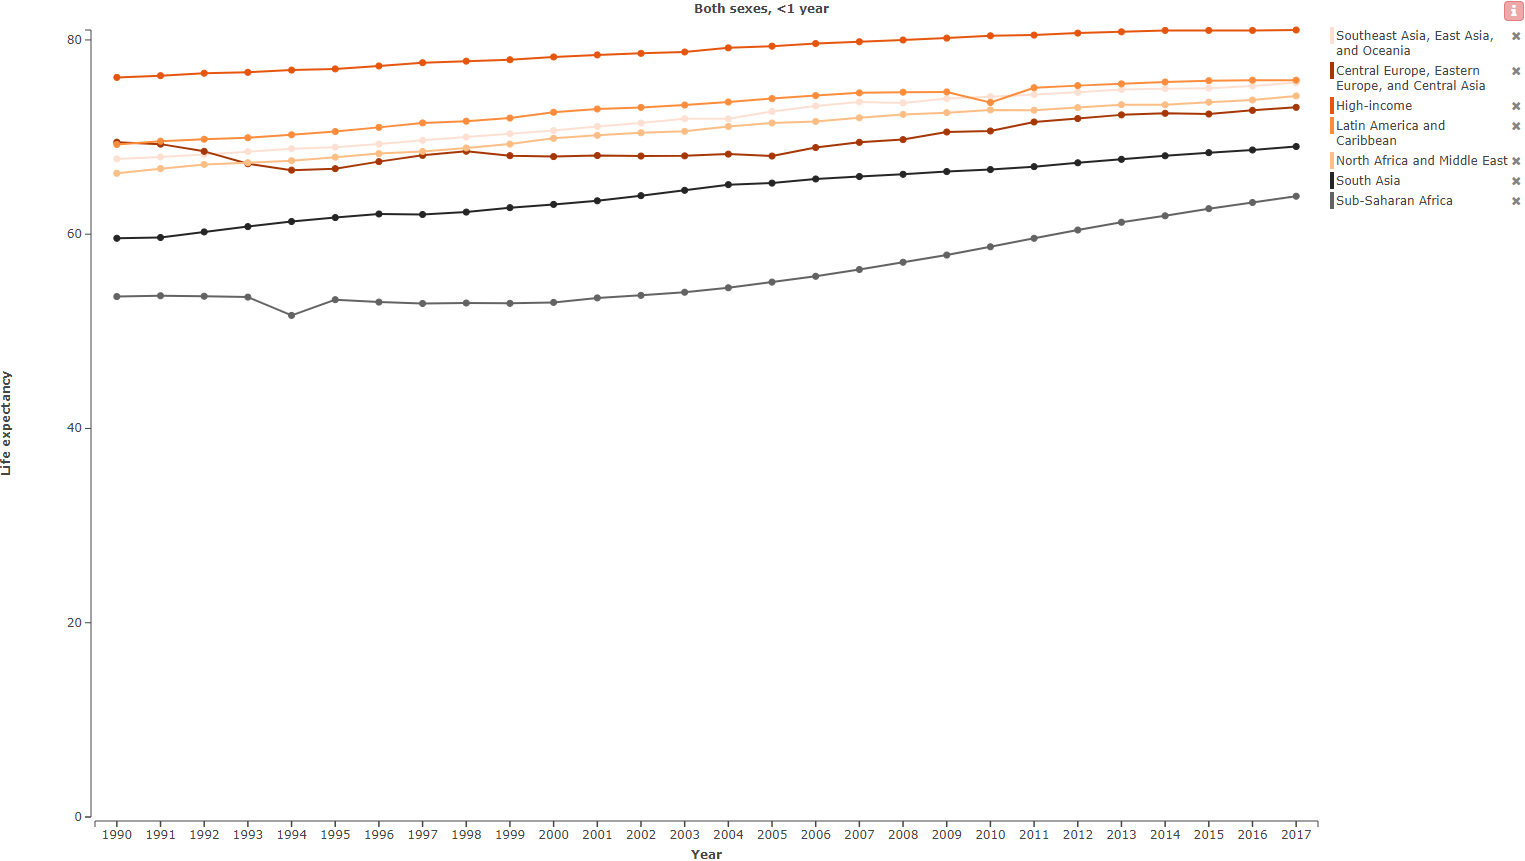
Life expectancy at birth, GBD super-regions, 1990–2017. Life expectancy at birth has increased in every region of the world since 1990.
What causes people to die?
In addition to knowing how long people live and how frequently they die, people concerned about population health want to know what kills people. Knowing how frequently people die of a particular cause helps guide efforts to improve population health. Therefore, researchers calculate measures like cause-specific mortality rates – which is the proportion of a population that dies of stomach cancer, malaria, or any other specific cause in a given time period.
Additionally, the GBD calculates its own metric of what kills people: years of life lost (YLLs). YLLs improve upon cause-specific mortality rates by measuring the time people lose when they die before attaining their ideal life expectancy – the years of potential life lost. This means that a person dying in old age results in fewer YLLs than a person dying at a young age.
Causes of death and cause-specific mortality rates give greater weight to causes that kill people late in life, while YLLs give more weight to causes of death that affect people when they are children or in the prime of their adult lives. That makes them an important tool for health policymakers who are looking to prevent these deaths. Research shows that people generally are more concerned about deaths at younger ages than deaths at older ages. Early death can be costly for societies – by, for example, preventing a lifetime’s worth of income or work, or leaving a family without their primary caregiver.
To give policymakers data that are useful for preventing early deaths, GBD establishes an ideal life expectancy. This ideal life expectancy is based on the lowest mortality rates in any age group in the world among populations of at least 5 million or greater. As an example, in 2017, the ideal life expectancy for males at age 20 was 62.6 years (which means that a 20-year-old would have 62.6 more years of life, dying at 82.6 years), observed in males in Switzerland. Therefore, if a young man in Nigeria (or Japan, or Venezuela, and so on) died in an accident at age 20 in 2016, GBD measures that as 62.6 YLLs.
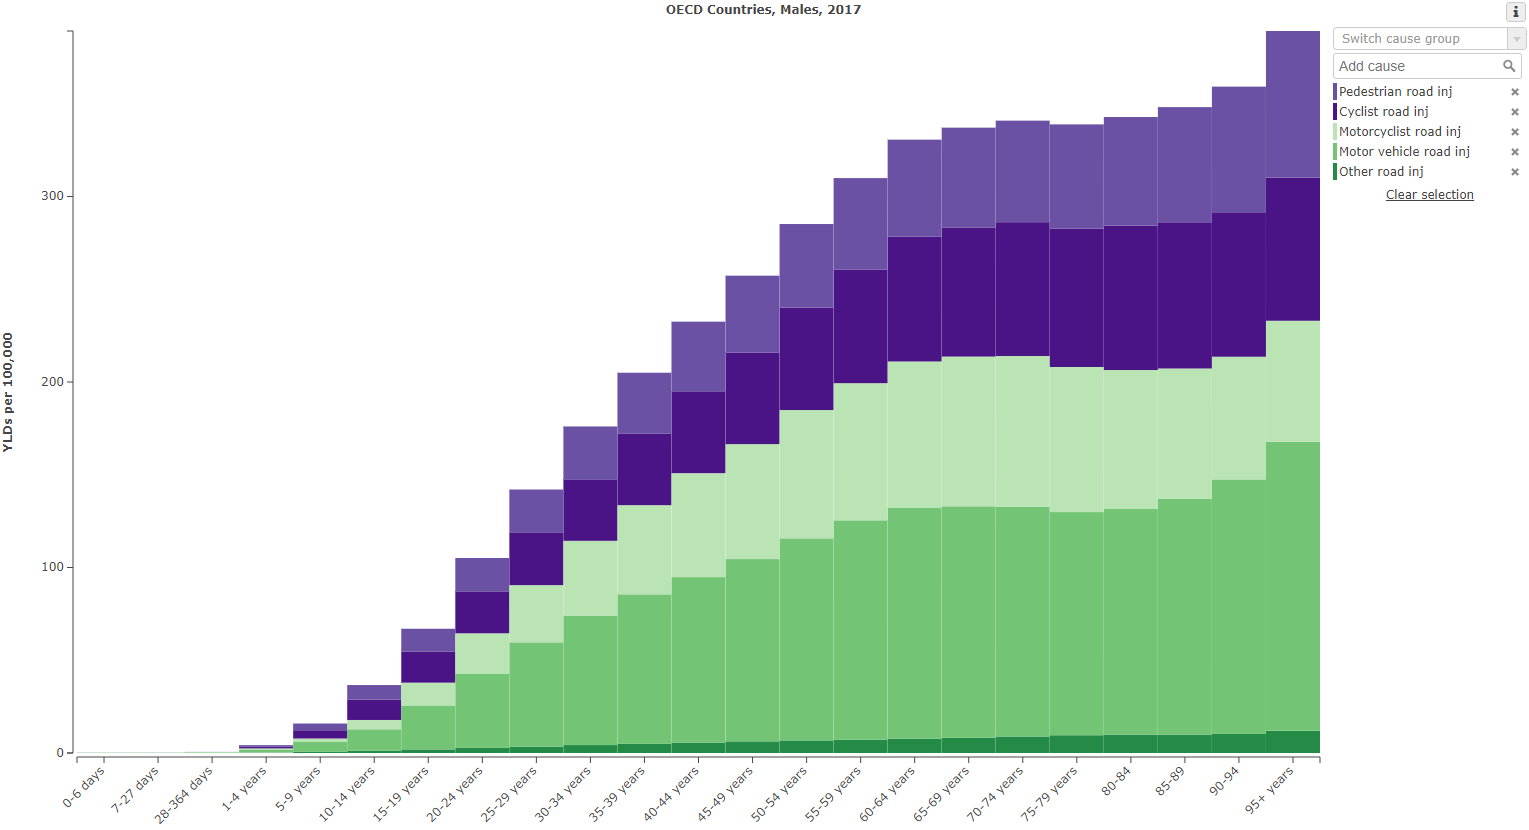
YLLs due to road injuries, age-standardized, males, member countries of the Organization for Economic Co-operation and Development, 2017
What causes people to get sick?
Population health is not just about death. Things that do not kill us but cause us suffering, such as depression or arthritis, also have an impact.
The GBD study, unlike traditional methods of describing population health, recognizes this by estimating the years lived with disability (YLDs) in populations. YLDs reflect the amount of time in a year that people live with any short- or long-term health condition, taking into account the severity of that condition. Therefore, time lived with schizophrenia results in more YLDs than the same amount of time lived with acne.
Adding together YLLs and YLDs yields disability-adjusted life years (DALYs), which is the principal metric of the GBD study. DALYs portray in one measure the total amount and severity of health problems experienced by a population due to both fatal and non-fatal causes. This metric allows health decision-makers to easily compare the burden from all of the causes of ill health within a population.
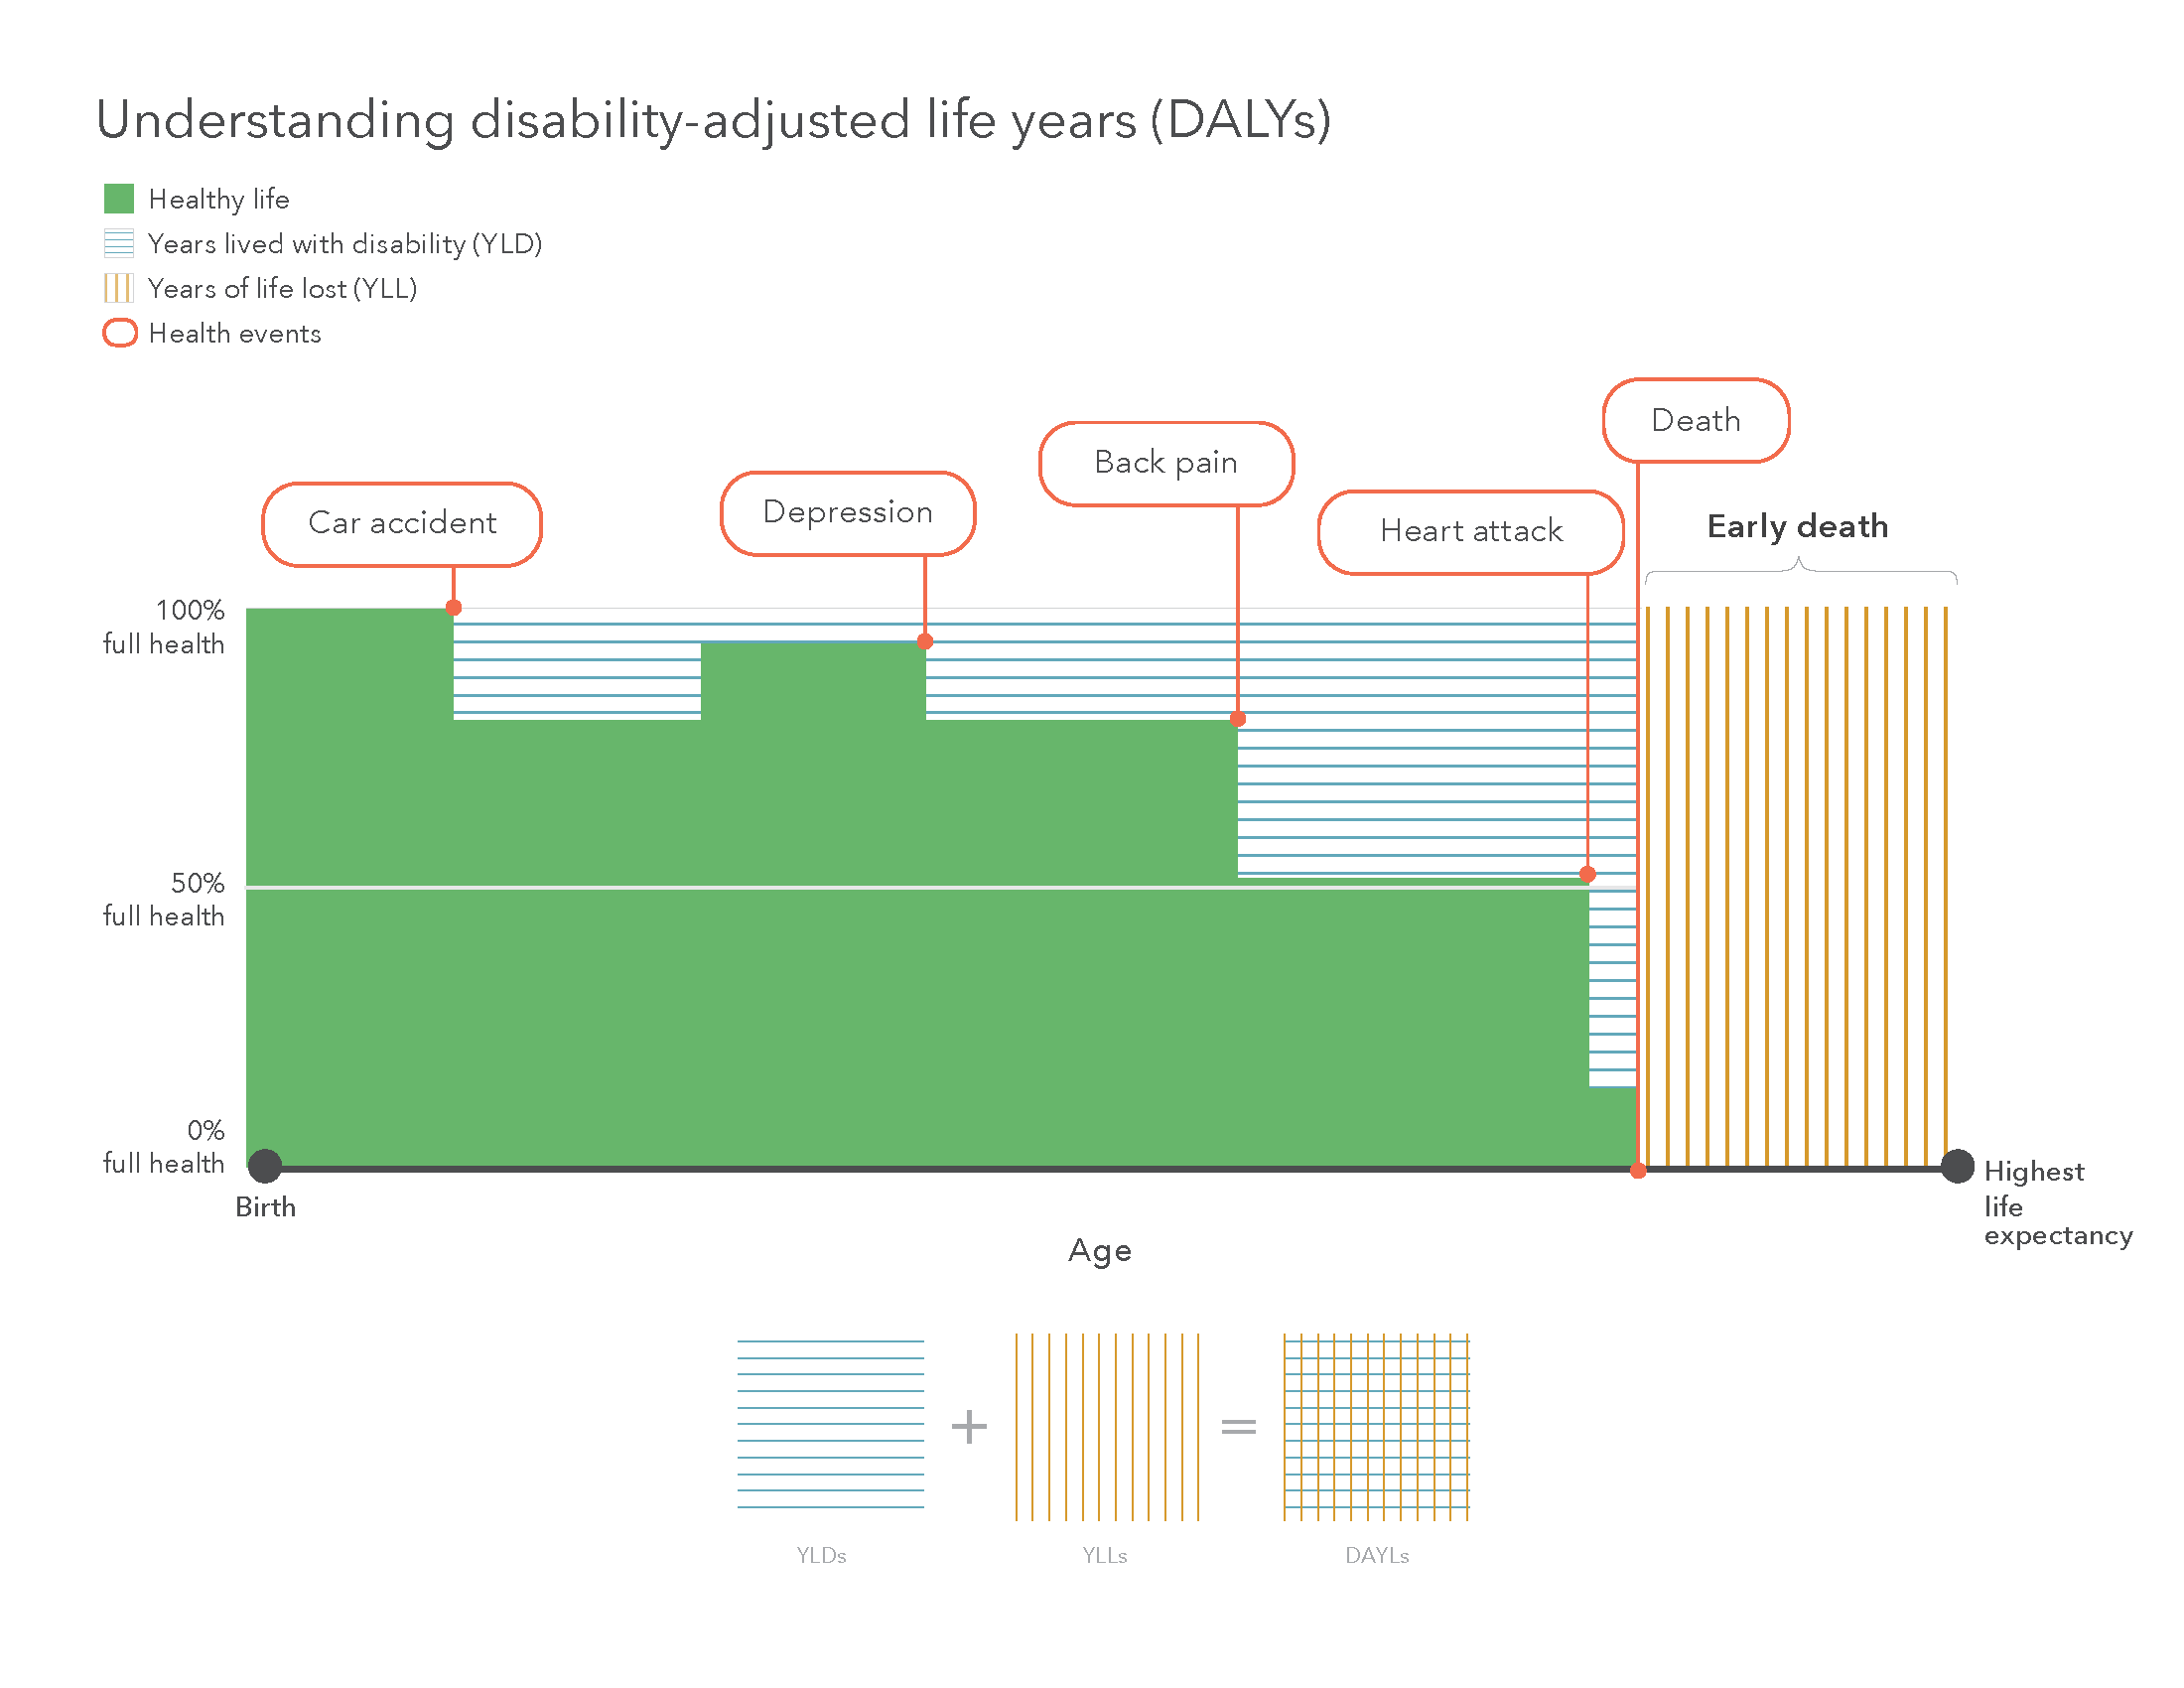
An illustrative example of how YLLs (disease burden due to early death) and YLDs (disease burden due to disability) could add up to DALYs in one person’s life. Tallying up the DALYs experienced by all the people in a population gives us a measure of the disease burden experienced by that population as a whole in a given year.
Related to DALYs, healthy life expectancy (HALE) builds upon traditional life expectancy measures by calculating the amount of time people live in good health. Just because people are living long lives doesn’t necessarily mean they are living healthy lives. For example, a person who dies in old age, but faces 20 years of debilitating health problems prior to dying, will suffer much more than a person who dies in old age following a healthy life and a short illness. HALE measures both the quality and the quantity of life.
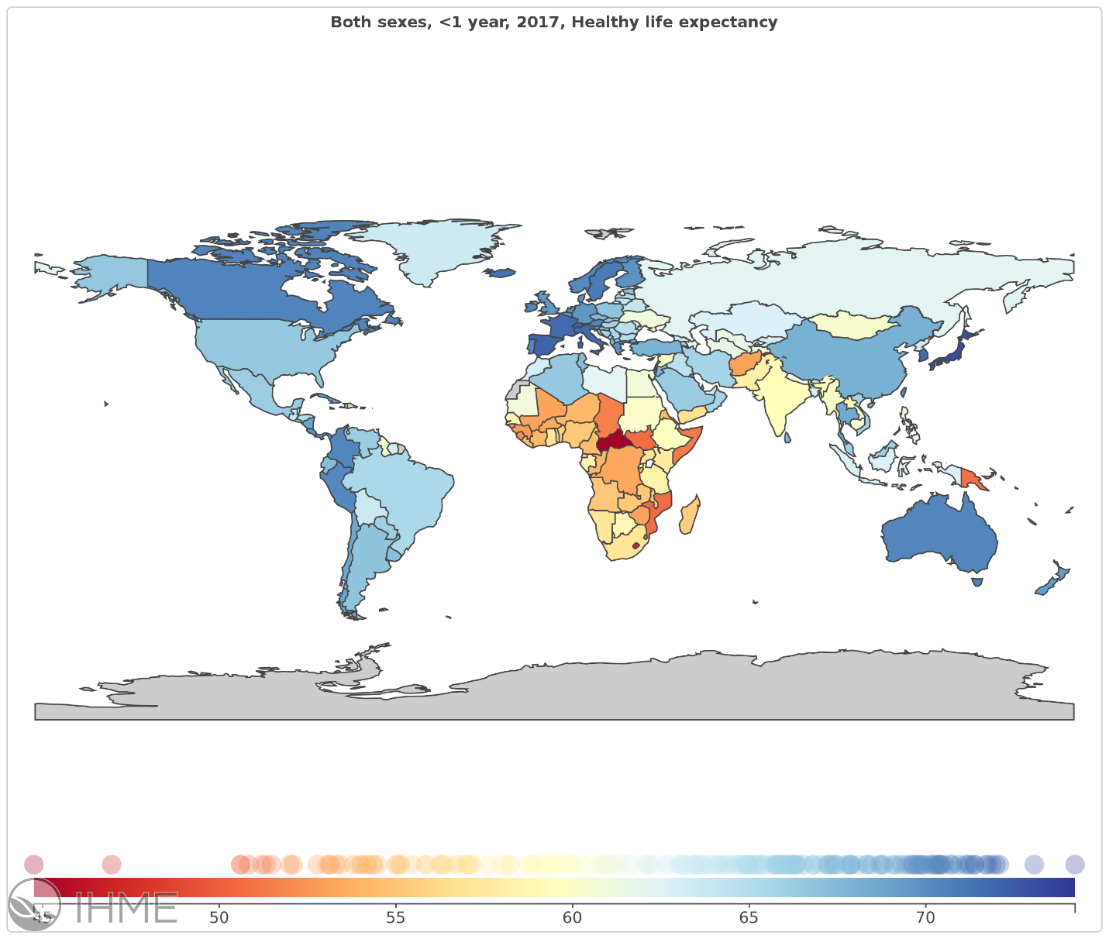
HALE for both sexes at birth, global, 2017
How does all of this compare with what could – or should – be happening?
These metrics, these ways of thinking about and comparing different aspects of health, not only offer a comprehensive picture of health within a population, but also allow policymakers to compare outcomes over time and across countries. That is a big benefit to policymakers, since making informed comparisons of health systems is a great starting point for improving them. For example, if an official in a country with a high number of DALYs due to diabetes knows that a similar country has had success in getting its citizens with diabetes into comprehensive treatment programs, that official can learn from that program, adapt it for use in their country, and potentially reduce disease burden due to diabetes.
To assist policymakers in making the best, most illuminating comparisons, the GBD study also calculates other policy-relevant metrics.
One such metric is health care access and quality (HAQ), an index that compares the ability of people to get quality healthcare in 195 countries around the world. HAQ is calculated while taking into account the health risks faced by people in different places and the likelihood that they will receive care that successfully treats life-threatening diseases – measuring mortality rates from causes that should not be fatal in the presence of effective medical care. Because HAQ is estimated from 1990, it captures changes in access and quality over more than 25 years.
And because sociodemographic development has been one of the key drivers of health improvements over the past 50 years, GBD calculates the Socio–demographic Index (SDI). SDI uses income (gross domestic product), education (average years of schooling), and fertility (the average number of children in women of reproductive age) to assess sociodemographic development in 195 countries from 1970 onward. When combined with other health data, SDI can show where societies have succeeded in improving health more quickly than would be expected given their development. That can reveal promising health interventions that others may want to replicate.
Putting it all together
The GBD metrics, then, are ways of answering questions that are essential for improving population health, doing so in ways that complement prior methods. They offer users the ability to make comparisons among populations, locations, and time periods that older methods may not. And they go even farther by measuring factors that affect health that were rarely captured in health metrics before the advent of the GBD. All that makes GBD metrics particularly useful to health policymakers, other government officials, researchers, those designing programs or interventions, or anyone curious about population health.