Jump to navigation

  • Contact us
  • Data catalog (GHDx)
  • Research library
Home
Main menu
  • Home
  • Research and analysis
    • Global Burden of Disease (GBD)
    • Health policy and planning
    • Health by location
    • Health risks and issues
    • Diseases and injuries
    • Training on our research
    • Research and news library
  • Data tools and practices
    • Interactive data visuals
    • Data sources
    • How we collect data
    • Data practices
    • Verbal autopsy tool
    • Training on tools
    • Data for the private sector
  • News and events
    • News media
    • Blogs
    • Events
    • Media contacts
  • About us
    • Vision and mission
    • Diversity, Equity, and Inclusion
    • Our people
    • Awards
    • Careers
    • History
    • Governance
    • Contact us

Explore section

News & Events

  • News media
  • Blogs
  • Events
  • Media contacts

COVID-19 vaccine hesitancy in the US by county and ZIP code


Twitter
Facebook
Google+
LinkedIn
Pinterest
Email
Print
Publication date: 
March 9, 2022

This data visualization was last updated at 4:00 p.m. Pacific, March 8, 2022.

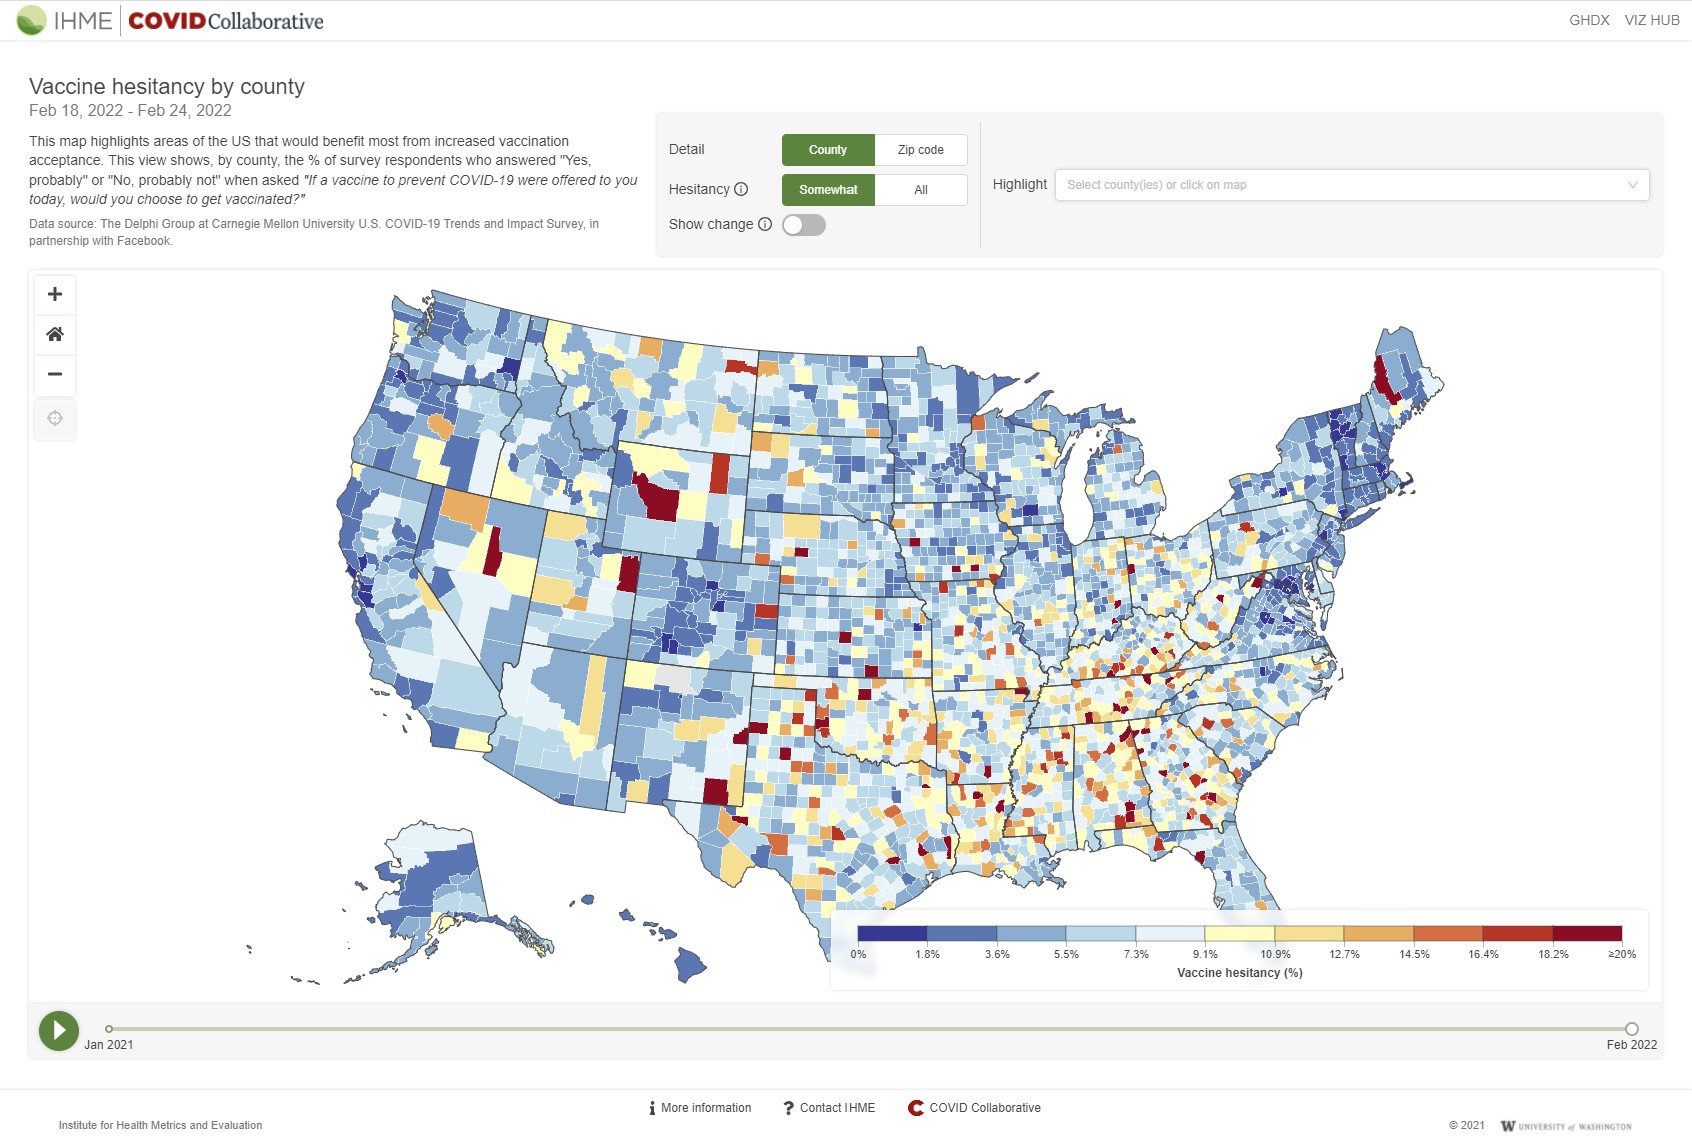
With our visualization tool, IHME in partnership with COVID Collaborative shows vaccine hesitancy in the US by county and ZIP code, highlighting which areas could benefit most from increased vaccine acceptance. This tool is designed for local government and health officials to determine how they can best direct vaccination campaign efforts and will be updated with new data periodically. Follow the links below for more information about the vaccine hesitancy visualization tool.

Data source: The Delphi Group at Carnegie Mellon University U.S. COVID-19 Trends and Impact Survey, in partnership with Facebook

Interact with the data visualization

Press Release

New tool shows more than 50 percent of the population is vaccine-hesitant in over 580 ZIP codes across the US (June 24, 2021)


Data Download and Findings

Data through February 24, 2022.

Vaccine Hesitancy Findings (March 9, 2022) - This document provides definitions and key takeaways from the files that follow.

  • 1_heatmap_percent_by_yes_states.pdf
  • 2_heatmap_percent_by_yes_states_FEB21_JUL21.pdf
  • 3_heatmap_percent_by_yes_states_AUG21_FEB22.pdf
  • 4_heatmap_percent_by_yes.pdf
  • 5_heatmap_percent_by_yes_FEB21_JUL21.pdf
  • 6_heatmap_percent_by_yes_AUG21_FEB22.pdf
  • Vaccine Hesitancy Regression Models.xlsx

Methods

Estimating COVID-19 vaccine hesitancy


Video

IHME Director Dr. Christopher J. L. Murray and COVID Collaborative CEO John Bridgeland introduce the new vaccine hesitancy visualization tool.


Contact Us

For inquiries from hospital, health department, or government officials: [email protected]

For media-related inquiries: [email protected] 

If you have questions about the COVID-19 vaccine or where you can get vaccinated, please visit the websites of the Centers for Disease Control and Prevention or the World Health Organization.

Find additional COVID-19 resources here.

Related Content

Data visualizations

COVID-19 vaccine hesitancy

This map uses survey data to show COVID-19 vaccine hesitancy in the US by county and ZIP code, as well as changes in hesitancy over time.

News releases

New tool shows more than 50 percent of the population is vaccine-hesitant in over 580 ZIP codes across the US

Data down to zip code level shows huge variations in vaccine hesitancy within counties. 

Publications

The vaccine-hesitant moment
Multiple surveys that were conducted to examine the sentiments concerning coronavirus disease 19 (Covid-19) vaccination have exposed new levels of volatility around vaccine hesitancy, particularly ...

Videos

Tutorial: COVID-19 vaccine hesitancy By ZIP code

IHME Director Dr. Christopher J. L. Murray and COVID Collaborative CEO John Bridgeland introduce a new visualization tool, showing COVID-19 vaccine hesitancy in the US by ZIP code and county.


News & Events

  • News media
  • Blogs
  • Events
  • Media contacts

Sign up for IHME News

Stay connected


Sign up for our newsletter

  • Contact us
  • Donate
  • Privacy policy

© 2023

         Home to Highly Cited Researchers 2022, Clarivate

  • Home
  • Research and analysis
    • Global Burden of Disease (GBD)
    • Health policy and planning
    • Health by location
    • Health risks and issues
    • Diseases and injuries
    • Training on our research
    • Research and news library
  • Data tools and practices
    • Interactive data visuals
    • Data sources
    • How we collect data
    • Data practices
    • Verbal autopsy tool
    • Training on tools
    • Data for the private sector
  • News and events
    • News media
    • Blogs
    • Events
    • Media contacts
  • About us
    • Vision and mission
    • Diversity, Equity, and Inclusion
    • Our people
    • Awards
    • Careers
    • History
    • Governance
    • Contact us