Jump to navigation

  • IHME
  • GHDx
  • GBD Compare
Home
Main menu
  • Home
  • Results
    • GBD Results Tool
    • Data Visualizations
    • Country Profiles
    • GBD 2019 Cause and Risk Summaries
    • US Health
    • Policy Reports
    • Research Articles
    • Infographics
    • Topics
    • Data & Tools
  • News & Events
    • News
    • Commentaries
    • Events
    • Videos
    • Acting on Data
    • Collaborator Spotlight
    • Think Global Health
  • Projects
    • COVID-19 resources
    • Global Burden of Disease (GBD)
    • View all
  • Get Involved
    • Donate
    • Careers
    • Call for Collaborators
    • The Roux Prize
    • GBD Emerging Researcher Award
    • Training and Workshops
  • About
    • Vision, Mission, and Principles
    • Statement on racism
    • Senior Management Team
    • Faculty
    • Data Transparency
    • Governance
    • History
    • Our data catalog
    • Terms and Conditions
    • Contact Us

Explore section

Results

  • GBD Results Tool
  • Data Visualizations
  • Country Profiles
  • GBD 2019 Cause and Risk Summaries
  • US Health
  • Policy Reports
  • Research Articles
  • Infographics
  • Topics
  • Data & Tools

COVID-19 vaccine hesitancy


Twitter
Facebook
Google+
LinkedIn
Pinterest
Email
Print
Publication date: 
June 24, 2021

Interact with the data visualization

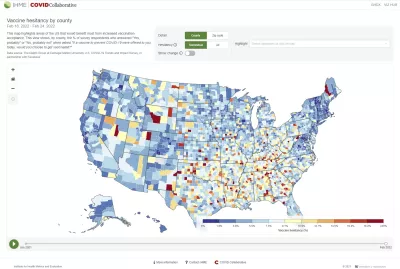
Explore changes in vaccine hesitancy in the United States through February 2022 with this interactive visualization tool. Based on survey responses, the tool shows percentage of people who are fully or somewhat hesitant towards the COVID-19 vaccine for 32,900 ZIP codes and 3,100 counties.

DATA AND FINDINGS

Data source: The Delphi Group at Carnegie Mellon University U.S. COVID-19 Trends and Impact Survey, in partnership with Facebook

Download the results from the tool

Vaccine Hesitancy Findings (March 9, 2022) - This document provides definitions and key takeaways from the files that follow.

  • 1_heatmap_percent_by_yes_states.pdf
  • 2_heatmap_percent_by_yes_states_FEB21_JUL21.pdf
  • 3_heatmap_percent_by_yes_states_AUG21_FEB22.pdf
  • 4_heatmap_percent_by_yes.pdf
  • 5_heatmap_percent_by_yes_FEB21_JUL21.pdf
  • 6_heatmap_percent_by_yes_AUG21_FEB22.pdf
  • Vaccine Hesitancy Regression Models.xlsx

BROWSER ISSUES

  • Use the latest version of Internet Explorer (currently IE11), Chrome, or Firefox.
  • Make sure to disable compatibility mode in Internet Explorer. In some cases, it renders a site unusable.
  • Use Ctrl+0 to reset the browser zoom. Sometimes having the browser zoomed in or out interferes with the layout or a few mouse-dependent properties.
  • If the visualization isn't loading or looks distorted, try clearing your cache. See http://www.wikihow.com/Clear-Your-Browser's-Cache for pointers.
Citation: 

Institute for Health Metrics and Evaluation (IHME). COVID-19 vaccine hesitancy. Seattle, WA: IHME, University of Washington, 2021. Available from https://vaccine-hesitancy.healthdata.org. (Accessed [INSERT DATE])

Related Content

News releases

New tool shows more than 50 percent of the population is vaccine-hesitant in over 580 ZIP codes across the US

Data down to zip code level shows huge variations in vaccine hesitancy within counties. 

Publications

Estimating COVID-19 vaccine hesitancy

We describe how we use survey data to estimate COVID-19 vaccine hesitancy in the United States.

COVID-19 vaccine hesitancy in the US by county and ZIP code

This map uses survey data to show COVID-19 vaccine hesitancy in the US by county and ZIP code, as well as changes in hesitancy over time.

Videos

Viz Tool | COVID-19 Vaccine Hesitancy By ZIP Code

IHME Director Dr. Christopher J. L. Murray and COVID Collaborative CEO John Bridgeland introduce a new visualization tool, showing COVID-19 vaccine hesitancy in the US by ZIP code and county.

Projects

COVID-19 resources

This page contains summaries of the results for 230+ locations, special analyses, explanations of the methods, and other tools to help understand our COVID-19 projections.


Results

  • GBD Results Tool
  • Data Visualizations
  • Country Profiles
  • GBD 2019 Cause and Risk Summaries
  • US Health
  • Policy Reports
  • Research Articles
  • Infographics
  • Topics
  • Data & Tools

Sign up for IHME News

Stay connected


IHME

Institute for Health Metrics and Evaluation

Population Health Building/Hans Rosling Center

3980 15th Ave. NE, Seattle, WA 98195

UW Campus Box #351615

Tel: +1-206-897-2800

Fax: +1-206-897-2899

© 2022

  • Privacy policy

  • Home
  • Results
    • GBD Results Tool
    • Data Visualizations
    • Country Profiles
    • GBD 2019 Cause and Risk Summaries
    • US Health
    • Policy Reports
    • Research Articles
    • Infographics
    • Topics
    • Data & Tools
  • News & Events
    • News
    • Commentaries
    • Events
    • Videos
    • Acting on Data
    • Collaborator Spotlight
    • Think Global Health
  • Projects
    • COVID-19 resources
    • Global Burden of Disease (GBD)
    • View all
  • Get Involved
    • Donate
    • Careers
    • Call for Collaborators
    • The Roux Prize
    • GBD Emerging Researcher Award
    • Training and Workshops
  • About
    • Vision, Mission, and Principles
    • Statement on racism
    • Senior Management Team
    • Faculty
    • Data Transparency
    • Governance
    • History
    • Our data catalog
    • Terms and Conditions
    • Contact Us