
Tobacco Visualization
Updated April 5, 2017
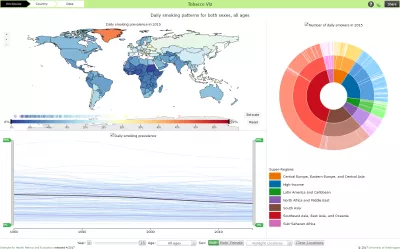
This interactive data visualization tool shows modeled trends in smoking prevalence worldwide and by country for the years 1980 to 2015. Data were derived from nationally representative sources that measured tobacco use.
Note: the data in this tool was last updated in 2017.
Citation
Institute for Health Metrics and Evaluation (IHME). Tobacco Visualization. Seattle, WA: IHME, University of Washington, 2017. Available from http://vizhub.healthdata.org/tobacco/. (Accessed [INSERT DATE])
Browser notes
- Use the latest version of Chrome, Safari, Edge, or Firefox.
- Use Ctrl+0 to reset the browser zoom. Sometimes having the browser zoomed in or out interferes with the layout or a few mouse-dependent properties.
- If the visualization isn't loading or looks distorted, try clearing your cache. See http://www.wikihow.com/Clear-Your-Browser's-Cache for pointers.