Health financing
Our health financing work examines health spending from governments, individuals, and other channels to inform policymakers about where resources for health are coming from and where they are going.
78%
of global spending on health care is in high-income countries, despite containing only 16% of the world’s population.
62%
of the total global health spending came from governments, but this amount varies dramatically by income group and across countries.
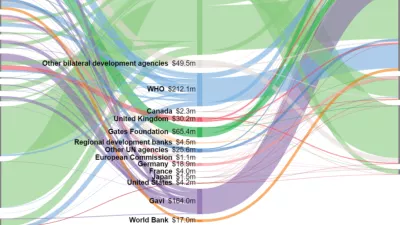
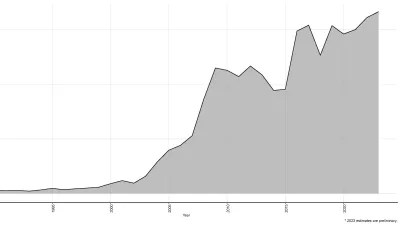
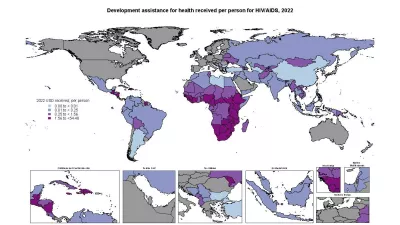
$84 billion
was provided as development assistance for health in low-income countries in 2021, reaching an all-time high spurred by the pandemic.
$8 per person
on average was spent on health by governments in low-income countries in 2023, despite basic health care costing between $60 and $86 per person.
Interactive data visuals


Datasets in our catalog
Visit the Global Health Data Exchange (GHDx) to download our estimates of health spending for most of the world’s countries over the last two decades, and forecasts of future spending through 2050.
Development Assistance for Health Database 1990-2023
Estimate
Development Assistance for Health Database 1990-2023
Development Assistance for Health on COVID-19 Database 2020-2023
Estimate
Development Assistance for Health on COVID-19 Database 2020-2023
Financing Global Health 2023
The Future of Health Financing in the Post-Pandemic Era