
Mortality Visualization
Updated March 11, 2024
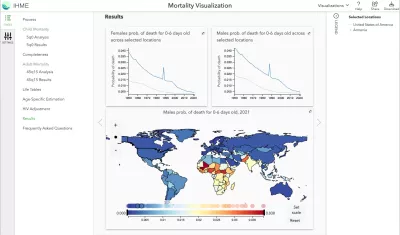
How do input data become GBD estimates? Walk through the estimation process for mortality trends for children and adults for 204 countries and territories using the Mortality visualization. See source and comparative data and step through the stages in the estimation process to reveal the final mortality estimates from 1950 to 2021. Learn more about the process by reviewing the “Frequently Asked Questions” section in the visualization. Data are available for download on the visualization.
Terms and conditions of use: For terms and conditions of use, please visit http://www.healthdata.org/about/terms-and-conditions.
Citation
Institute for Health Metrics and Evaluation (IHME). Mortality Visualization. Seattle, WA: IHME, University of Washington, 2024. Available from http://vizhub.healthdata.org/mortality/. (Accessed [INSERT DATE])
Browser notes
- Use the latest version of Chrome, Safari, Edge, or Firefox.
- Use Ctrl+0 to reset the browser zoom. Sometimes having the browser zoomed in or out interferes with the layout or a few mouse-dependent properties.
- If the visualization isn't loading or looks distorted, try clearing your cache. See http://www.wikihow.com/Clear-Your-Browser's-Cache for pointers.