
Predicted impact of vaccine mandates in King County
Published September 16, 2021
Summary
The objective of this analysis was to investigate the impact of requiring individuals to be vaccinated before entering specific non-essential venues on COVID-19 cases, hospitalizations, and deaths. This analysis focuses on one component of the proposed mandate, specifically, requiring proof of vaccination to enter bars, restaurants, and gyms. It is important to note that this analysis ignores other components of the proposed mandate (e.g., restrictions at large events).
As described below, we used two approaches (which we denote “minimum effect” and “maximum effect”) to estimate the impact of this combined intervention, which we incorporated with varying assumptions on adherence to the requirements for bars, restaurants, and gyms to arrive at a range of potential impacts. Using these estimated impacts, we ran our COVID-19 forecasting model forward six months for King County, assuming the intervention was implemented on October 25, 2021. We then tracked infections, reported infections, hospitalizations, and deaths in both our baseline scenario and the various intervention scenarios to calculate averted COVID-19 burden.
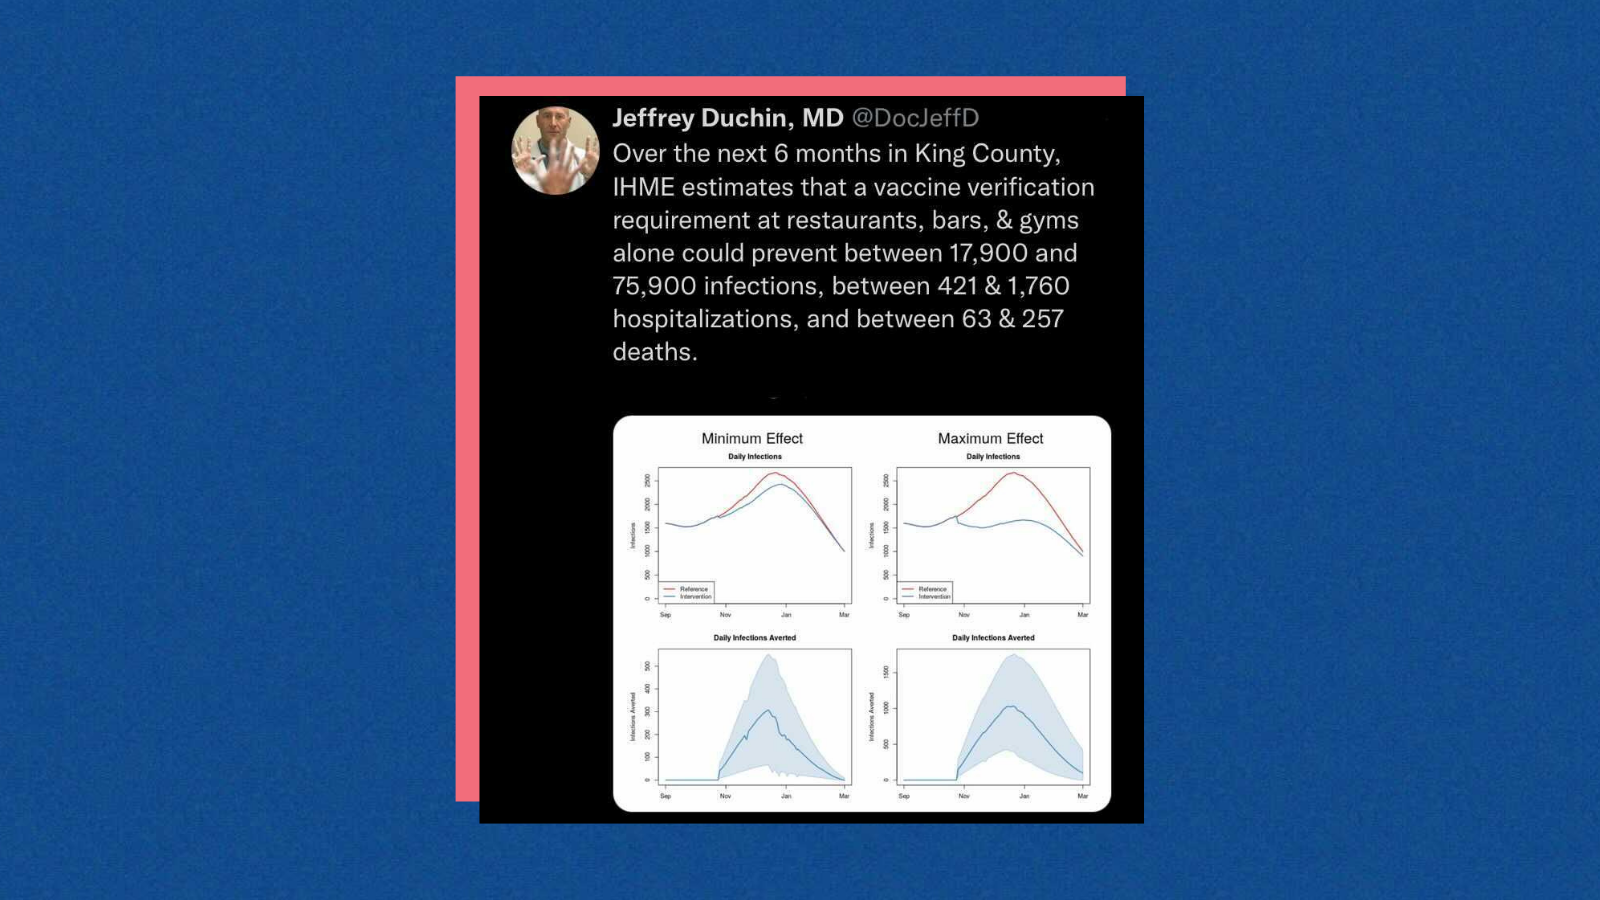
Complete results are below, but in summary, we estimate that over the next six months (September 1st, 2021 to March 1st, 2022), this intervention would prevent substantial infections, detected infections, hospitalizations, and deaths. Using our “minimum effect” estimate, this intervention is expected to avert 17,900 SARS-CoV-2 infections (90% uncertainty interval: 3,440–35,100). This translates into 8,110 averted detected infections (1,550–15,900), 421 averted hospitalizations (80–823), and 63 averted COVID-19 deaths (12–123). Optimistically, under the “maximum effect” estimate, the number of averted infections jumps to 75,900 (25,400–147,000) and 33,900 averted detected infections (11,500–64,600). In this scenario, we predict 1,760 averted hospitalizations (598–3,350) and 257 averted COVID-19 deaths (90–476).
Approach
Our primary assumption with this analysis was that we could leverage estimates of the impact of previous restrictions on specific business closures as well as estimates of the effectiveness of vaccines to prevent SARS-CoV-2 transmission to approximate the impact of the proposed intervention. Were the vaccine to perfectly prevent transmission, we are assuming that the impact of requiring individuals to be vaccinated before entering a bar, restaurant, or gym would be the same on transmission as if that venue was closed due to a mandate. The vaccine is not, in fact, perfect at preventing infection, so we reduce the impact of the intervention proportionally to the average efficacy of preventing infection of the vaccines distributed in King County.
Over the past year, IHME has been collecting data on mandates such as non-essential business closures or restrictions on large gatherings that are more detailed than those we currently include in our COVID-19 model (e.g., primary school, secondary school, and higher education closures instead of just “school closure”). To date, we have collected data on 23 detailed mandates across all locations we model. It is important to note that the scale at which mandates are implemented is frequently more local than the location set we model. As an example, we model California as one location while, in fact, some mandates may be implemented at the county or city level. Our mandate data for a location is a weighted average of the mandate for the region it represents. Due to the local and focal nature of SARS-CoV-2 transmission, any analyses we conduct looking at the relationship between transmission intensity and our coarse approximations of mandate status must be considered carefully.
Within our COVID-19 model, once we triangulate past infections using case data, hospitalizations, and deaths, we convert past infections into transmission intensity while accounting for immune and vaccine status. We then perform a regression to identify the magnitude of the relationships between past transmission intensity and key drivers of transmission. Our standard model includes as drivers: average mask usage (which is updated regularly and shows a substantial increase in King County since the recent mask mandate’s implementation); testing rates; seasonality; mobility; and several static location-specific covariates (such as population density). This model also includes past observed and future forecasted vaccination rates. To analyze the impact of a detailed mandate, we use this regression to identify an effect size.
Detailed mandates are difficult to analyze due to their collinear nature – mandates are frequently implemented in groups, so it is difficult to parse the effect of a single mandate. In many regions, numerous mandates have been in place for long periods of time, so it is difficult to estimate what the impact would be if they were removed. As such, we took two approaches: one that ignored this collinearity and analyzed all mandates together (thus likely reducing the estimated effectiveness of each mandate were it to be implemented in isolation) and one that looked at the effect of each mandate as if it was applied in isolation (ignoring the fact that any effect may be due to another mandate that was concurrently implemented). We denote the reduced effectiveness estimate as the “minimum effect” and the estimate in isolation as the “maximum effect.” For both, we took the median value of the effect size as well as the 5th and 95th percentile values to incorporate uncertainty in these estimates on our final metrics.
Finally, we have estimated that the vaccines that are in use in King County on average are 65.2% effective at preventing transmission. As such, we used this quantity to alter the estimated effect of the mandates, as those who are vaccinated are still able to transmit SARS-CoV-2 (albeit with a lower probability).
We ran scenarios against our current baseline model for six months. Of particular note, the current baseline model incorporates recent observed increases in mask usage since the recent mask mandate. We assumed the intervention was enacted on October 25. For each scenario, we calculated the number of averted infections, detected infections, hospitalizations, and deaths. Our model already has a focused location specifically tracking these quantities in King and Snohomish Counties, so to get estimates for King County we assumed a population weighted proportional split.
Results
While there was large uncertainty in the estimates due to a large uncertainty in the exact effect size of the proposed intervention, both scenarios showed substantial reduction in infections, detected infections, hospitalizations, and deaths. Over the next six months, due in large part to the Delta surge, our baseline scenario predicts there will be 352,000 infections in King County, which will translate into 164,000 detected infections, 8,380 hospitalizations, and 1,280 deaths. We predict peak transmission of the winter surge to occur in mid- to late December (Figure 1, top panels). The timing of the proposed intervention serves to flatten this peak in both scenarios, but is, unsurprisingly, most marked in the maximum effect scenario (Figure 1, top right panel, blue line).
| Minimum effect | Maximum effect | |
Infections averted | 17,900 (3,440–35,100) | 75,900 (25,400–147,000) |
| Detected infections averted | 8,110 (1,550–15,900) | 33,900 (11,500–64,600) |
| Hospitalizations averted | 421 (80–823) | 1,760 (598–3,350) |
Deaths averted | 63 (12–123) | 257 (90–476) |
Table 1: Estimated averted COVID-19 burden compared to baseline scenario (90% uncertainty intervals in parentheses)
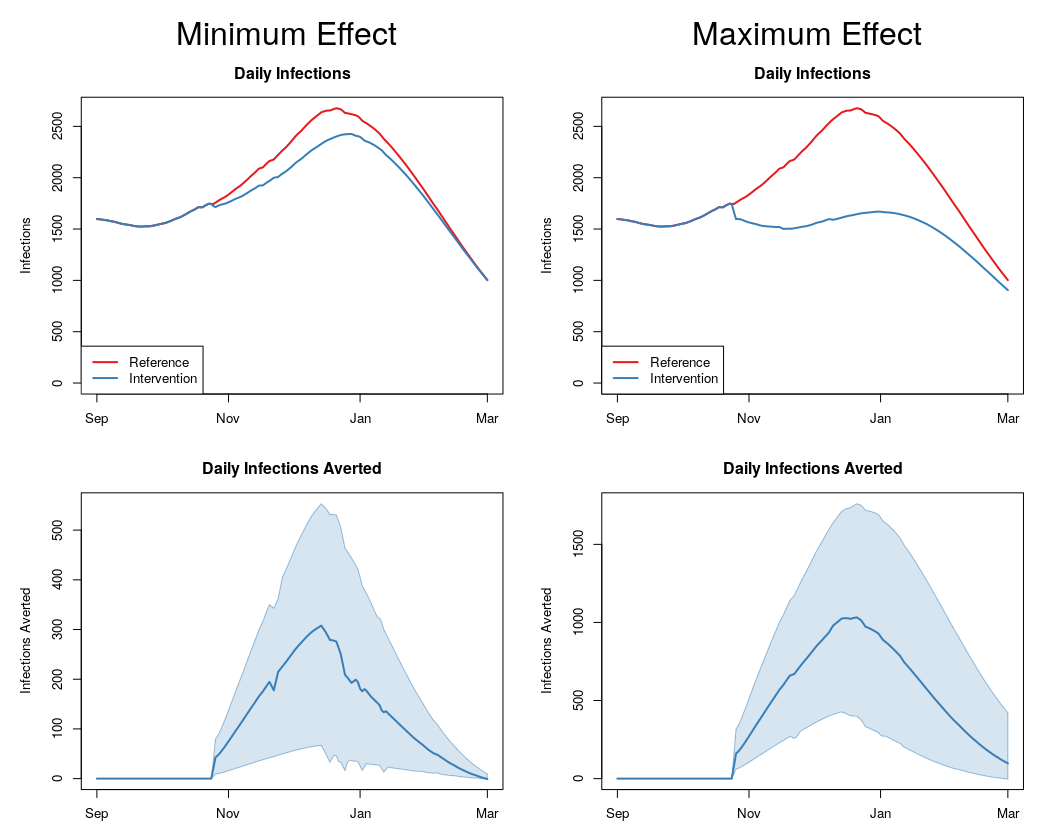
Figure 1: Infections and averted infections across scenarios