
COVID-19 model update: Omicron and waning immunity
Published December 22, 2021
This page was updated on December 22, 2021 to reflect changes in our modeling strategy.
COVID-19 model update: Overview
The past IHME COVID-19 model was unable to incorporate waning immunity (infection-derived or vaccine-derived). The previous model distinguished two types of variants: ancestral and alpha and the escape variants and could not accommodate differential cross-variant immunity by variant. In this new model, we have incorporated explicitly the major variants: ancestral, Beta, Gamma, Delta, and Omicron; and incorporated waning immunity, both vaccine-derived and infection-derived. To do this, we adopt a fundamentally new model structure.
The new model structure is a system of integro-differential equations where individuals are split by which variant they were most recently infected by (if any) as well as what round of vaccination they most recently completed (if any). Moreover, within each compartment, the time since last infection and last vaccination is also tracked, so waning protection due to past infection and vaccine-derived immunity can be estimated. In addition to waning immunity being a function of time, protection from infection is a function of which vaccine an individual most recently received, the variant they were most recently infected by, and the variant they are being challenged by. We assume protection from infection and vaccine interact multiplicatively. For example, if an individual has a 75% reduction in their chance of infection due to a previous infection and a 50% reduction in their chance of infection due to a previous vaccine, their total protection is an 87.5% reduction in transmission probability [(1 – 0.75)(1 – 0.5) = 0.875]. For each combination of past infection and vaccination status, by tracking the estimated timings of these infections and vaccinations, we are able to calculate an average protection which effectively reduces the susceptibility of those individuals.
Estimates of waning immunity (vaccine- or infection-derived) are discussed below in Waning protection, and estimates of cross-immunity are discussed below in Cross variant immunity. More detail on the precise model formulation can be found in the Technical Appendix.
In addition to accounting for waning protection to infection based on both infection history and vaccination history, our model accounts for waning protection to hospitalization and death in a similar way. As in the previous model formulation, hospitalizations and deaths are assumed to occur long enough after initial infection as to not influence transmission dynamics and are thus estimated post hoc. That said, the same principles apply regarding the influence of “time since infection” and “time since vaccination” on protection. Based on available data (discussed below), the associated speed of waning protection to hospitalization and death is considerably slower than waning protection to infection.
Vaccine efficacy, including efficacy against the Omicron variant and third doses
We updated estimates of vaccine efficacy against infection and severe disease from the Delta variant using 10 studies covering six countries. The resulting pooled effect size is shown in Table 1.
Table 1. Estimates of vaccine effectiveness for specific vaccines used in the model at preventing severe disease and infection
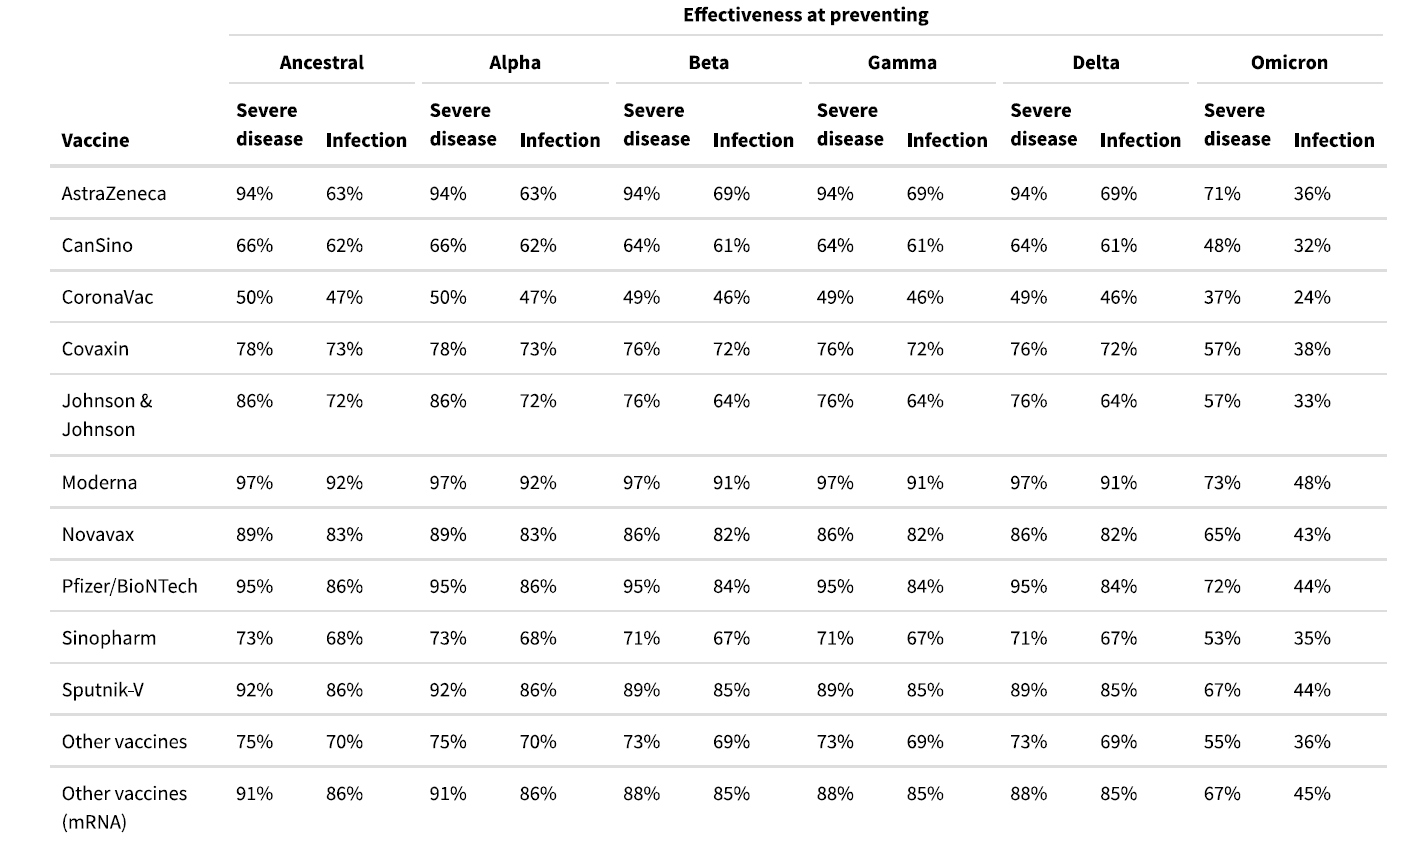
Neutralizing antibody studies have demonstrated a 20- to 40-fold reduction in neutralizing antibody levels with the two-dose Pfizer-BioNTech vaccine for the Omicron variant compared to ancestral variants. A test-negative case-control study in South Africa showed a reduction in two-dose Pfizer-BioNTech vaccine efficacy against all symptomatic disease from 80% for the Delta variant to 33% for the Omicron variant.1 Protection against severe disease was reduced from 93% for the Delta variant to 70% for the Omicron variant.1 The reduction in efficacy was similar in a test-negative case-control study in England that showed a reduction from 79% for the Delta variant for two-dose Pfizer-BioNTech vaccine 10-14 weeks after the second dose to 50% for the Omicron variant for all symptomatic disease.2,3 To estimate the baseline efficacy of each of the vaccines against the Omicron variant, we applied the average relative reduction in vaccine efficacy against all symptomatic disease from the South Africa and England studies to the efficacy against Delta variant infection. For severe disease (hospitalization and death), we use the relative reduction in vaccine efficacy for severe disease from the South Africa study.
A single study shows that a third dose of the Pfizer-BioNTech vaccine returns neutralizing antibody levels to levels similar to those produced in response to ancestral variants. The England case-control study shows that protection levels are improved with a booster dose but not to the level observed against the Delta variant. We assumed that a third dose (second dose for the Johnson & Johnson vaccine) would result in vaccine efficacy against the Omicron variant that is the average of the baseline efficacy against the Delta variant and the baseline efficacy against the Omicron variant.
Waning protection
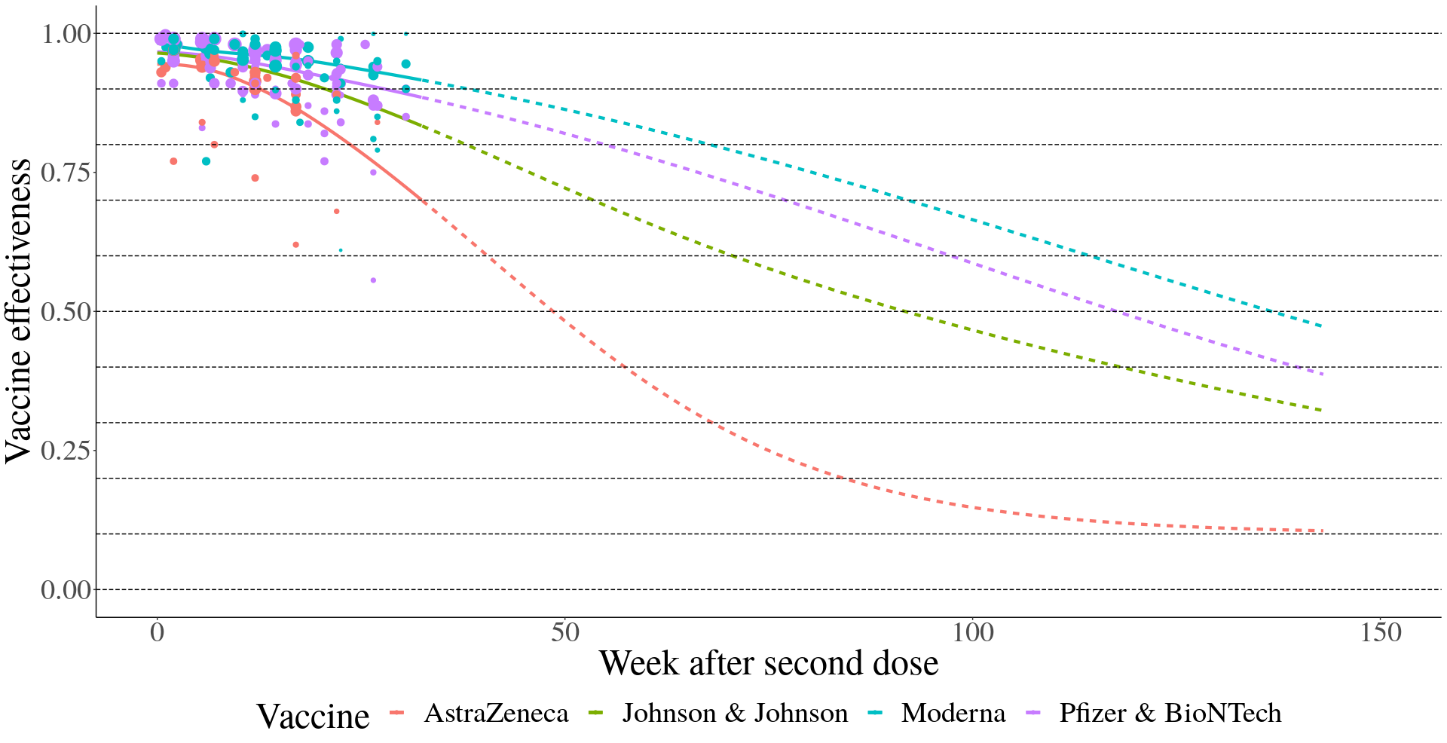
Several studies have documented waning protection of vaccine- and infection-acquired protection. To estimate waning protection from vaccination, we systematically compiled 20 studies from nine countries that estimated vaccine efficacy as a function of time since the second dose. For each vaccine and outcome separately (infection, all symptomatic disease, and severe disease, defined as hospitalization or death), we used Bayesian meta-regression with a monotonically decreasing spline on time since second dose to estimate waning curves by vaccine and outcome. We fit these models in bounded logit(efficacy) space with a constraint that efficacy cannot decline below 10%. The resulting efficacy curves by time since first dose are show in Figure 2 for infection as the outcome and Figure 3 for severe disease. As data were limited to the Pfizer-BioNTech, Moderna, and AstraZeneca vaccines, we used the average relative waning for all other vaccines.
Figure 2. Waning immunity by week after second dose against infection
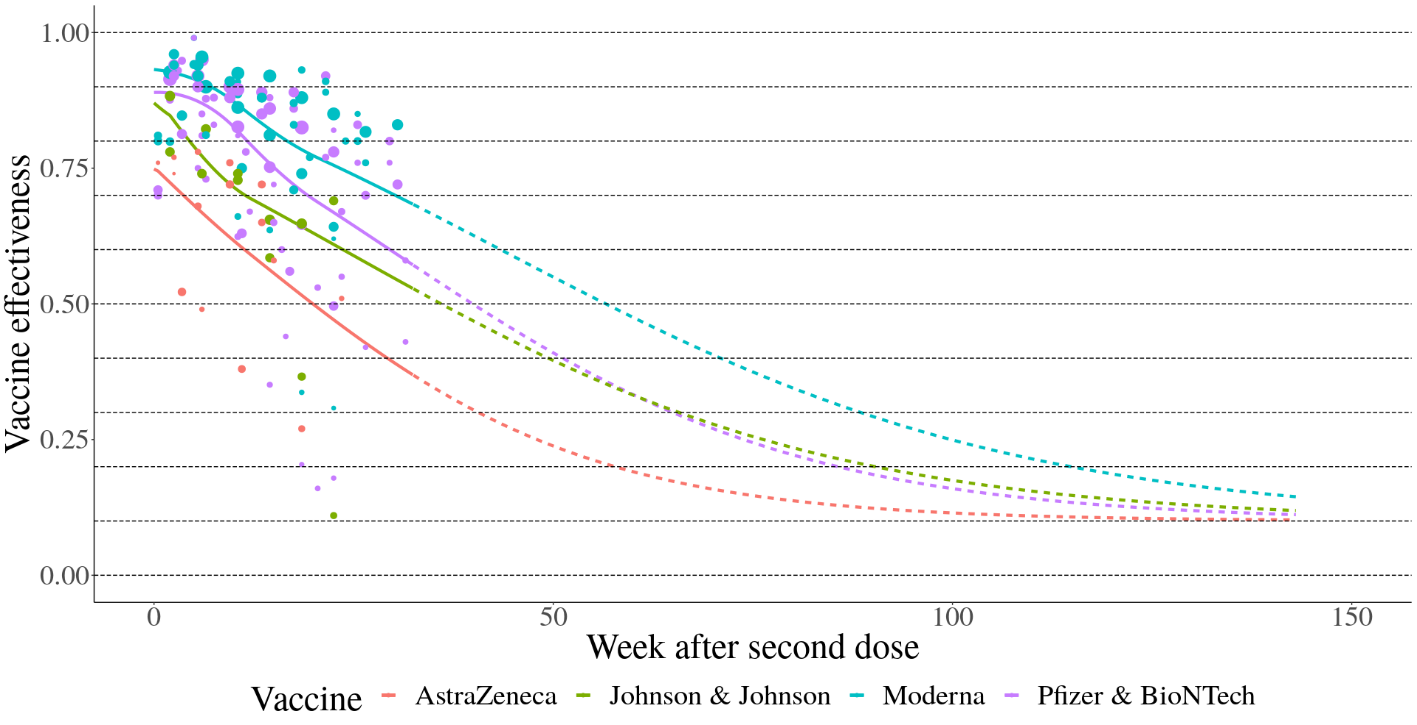
Figure 3. Waning immunity by week after second dose against severe disease
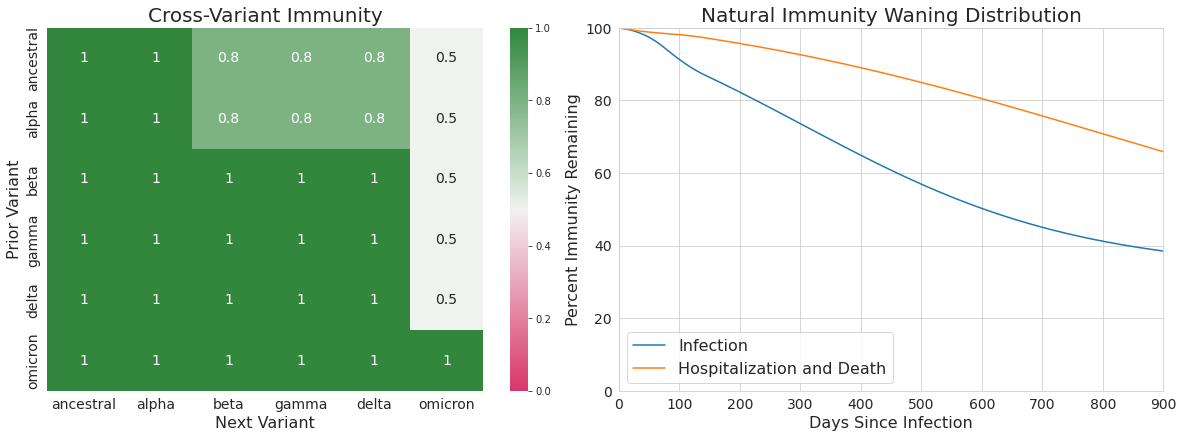
For waning of infection-derived immunity, we assumed protection was the weighted average of the best vaccine-derived immunity (i.e., the immunity derived from Moderna) and perfect immunity. Specifically, at any time since last infection t, the protection associated with infection-derived immunity is equal to: 0.75 · Ɛ(t) + 0.25 where Ɛ(t) is the estimated vaccine-derived immunity of Moderna t days after completing the first round of vaccination.
Cross variant immunity (including Omicron breakthrough infections)
Studies in South Africa and England suggest a marked increase in the risk of reinfection compared to the risk of primary infection (infection among those without a documented history of COVID-19 infection). In England, the ratio of reinfection risk to primary infection risk ranged from 0.13 to 0.33.3 In South Africa, the ratio of reinfection risk to primary infection risk has increased during the Omicron wave to above 0.3.4 These studies are likely biased toward estimating a lower reinfection risk given there is incomplete ascertainment of past infection in these populations. For the purposes of our projections, we assume that cross-variant immunity for the Omicron variant ranges between 40% and 60%.
These values build on our existing estimates of the relative likelihood of a breakthrough infection based on pre-Omicron evidence of breakthrough infections being more likely to be associated with Beta, Gamma, and Delta than Alpha. Specifically, our assumptions of crossvariant immunity between each variant pair are shown in Table 2 and are used within our transmission model to alter the relative transmission intensity depending on the most recent infection and the variant an individual is being challenged with. As before, more detail on the precise model formulation and how cross-variant immunity is incorporated into transmission can be found in the Technical Appendix.
Table 2. Cross-variant immunity adjustments
Adjustments to the hospitalization and fatality rate with the Omicron variant
Data from Discovery Health1 in South Africa show that the risk of confirmed cases of COVID-19 being admitted to hospital is around a quarter less during the Omicron wave than in the previous Delta wave. Hospitalized cases during the Omicron wave were also four times less likely to be admitted to the ICU compared to hospitalized cases during the previous Delta wave. In addition to the reduction in the propensity to be admitted to hospital and the likelihood of severe outcomes once an individual is hospitalized, multiple population-based PCR screening studies in South Africa further suggest that Omicron may also result in a substantially larger fraction of asymptomatic cases that are not identified by routine testing compared to previous variants. In a clinical trial volunteer population in South Africa, asymptomatic infection was 31%, while in a population of South African health care workers, asymptomatic prevalence of COVID-19 infection was 16% during the Omicron time period compared to 2.6% during the Beta and Delta periods.5 This finding suggests an even larger reduction in both the infection-hospitalization rate (IHR) and the infection-fatality ratio (IFR).
Several observations from other countries support the notion that the Omicron variant leads to substantially lower rates of hospitalization than the Delta variant. In England, based on S-Gene Target Failure (SGTF) cases, only 129 hospitalizations and 14 deaths have been observed in more than 120,000 cumulative cases, as of December 20.6 Using a conservative seven-day lag between cases and hospitalizations, this equates to a case-hospitalization rate (0.3%) that is substantially lower than for previous variants. In both Norway and Denmark, a transition to the Omicron variant from the ongoing Delta variant surge has been associated with a notable slowing of the hospital admission rate.
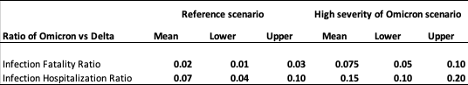
Based on the evidence to date above, we assume the reductions in the infection-fatality ratio (IFR) and infection-hospitalization ratio (IHR) under the reference and high severity of Omicron scenarios as shown in Table 3.
Table 3. Adjustments to the infection-hospitalization rate and infection-fatality rate for the Omicron variant relative to the Delta variant
Technical Appendix
General model structure
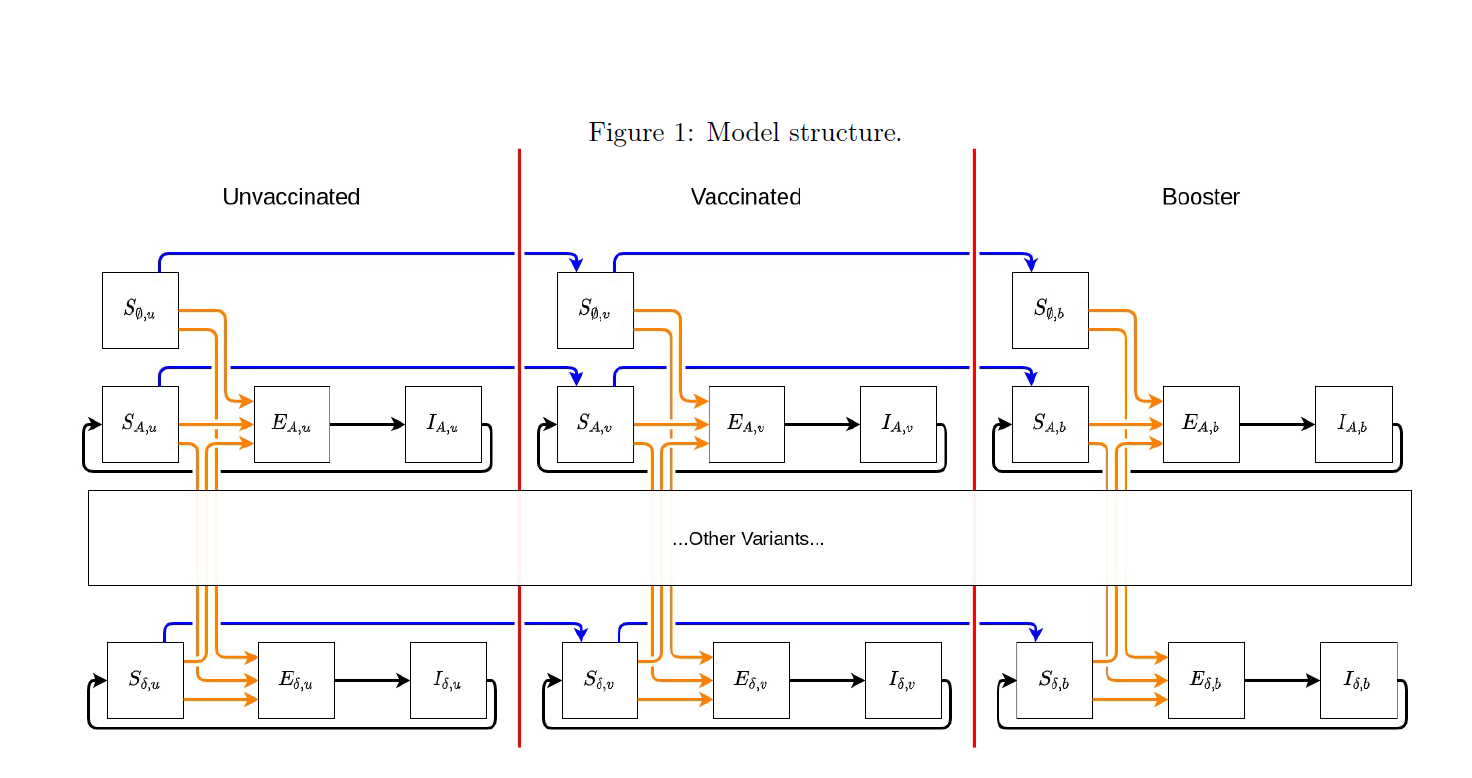
Integro-differential equations: The general structure of the new model is a variant- and vaccine status-specific system of integro-differential equations. The model tracks, by day and location, the number of individuals who have yet to become infected by any variant as well as the variant of the last infection for those who have already been infected once (note, individuals who have experienced multiple infections will be tracked only by their last infection). Additionally, the model tracks individuals who have not been vaccinated, those who have completed their first complete ROUND of vaccination, and those who have completed a second ROUND of vaccines (i.e., received a booster). We are currently tracking infections attributable to one of seven variants (or variant classes: ancestral, Alpha, Beta, Gamma, Delta, Omicron, and “other”) as well as those who have never experienced an infection. As such, for those who are not actively infected or infectious, there are (7 + 1) * 3 = 24 unique possible “susceptible” states. As an example, individuals who most recently had a Delta infection are broken into three groups: Delta infection and never vaccinated; Delta infection and completed first vaccine course; Delta infection and completed second vaccine course.
Effective susceptibility: The model formulation manifests partial immunity (and thus partial protection from infection) as a reduction in the relative risk of infection compared to an individual who has never been vaccinated or infected (Figure 1, top left compartment). Susceptible individuals in every other compartment are compared to this group (unvaccinated, never infected). For individuals in any of the other 23 susceptible states, the longer they stay in that state without exiting (either by becoming infected or upgrading vaccine status), the lower their protection against future infection.
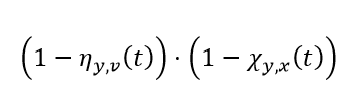
We assume that protection derived from vaccine interacts multiplicatively with protection derived from natural infection. In particular, let Ɛ be the protection an individual derives from vaccines against a given variant (e.g., Ɛ = 0.95 implies a person’s relative risk of infection to that variant is 5% that of an unvaccinated person). Moreover, let ϕ be the protection an individual derives from natural infection against the same variant. Then we would estimate this individual’s overall protection to that variant to be
1 – (1 – Ɛ) · (1 – ϕ)
and, thus, this person’s chance of infection to the given variant would be (1 – Ɛ) · (1 – ϕ) the size of an unvaccinated, never infected individual. For this individual, we define their effective susceptibility to the given variant to be (1 – Ɛ) · (1 – ϕ). It is critical to note that this quantity depends on:
- What the variant was of the last infection
- When that last infection occurred
- What the brand of the individual’s last vaccine dose was (Note: in our model, protection is exclusively defined by the brand of the last dose)
- When that vaccination occurred
- What variant the individual is being challenged with
As such, there are many, many different Ɛs and ϕs, and they vary by variant and time.
To estimate effective susceptibility to a given variant within a state, we take the average of the individual effective susceptibility to that variant of every member of the state (taking into consideration how long they have been in the state). Expanding on the notation above, we let Ɛx,v(τ,c) be the efficacy of vaccine brand c after vaccine round v against variant x,τ days after completing the vaccine round. If, for a given time t, we let Ψv(t – τ,c) be the number of individuals in a particular susceptible compartment (associated with vaccine round) who completed their last vaccine round τ days in the past, then we can estimate the average protection in that particular susceptible compartment to variant x as:
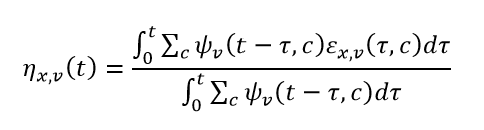
where the denominator of the expression above is the total number of individuals in the particular susceptible compartment.
Similarly, we can expand the notation around naturally derived immunity. Letting Φx,y(τ) be the immunity against variant x after being infected by variant y, τ days in the past, and NEx,v(t – τ) be the number of new infections to variant x in vaccine round v, t – τ days in the past, we can estimate the average protection against variant y attributable to natural infection of all individuals who were most recently infected by variant x as:
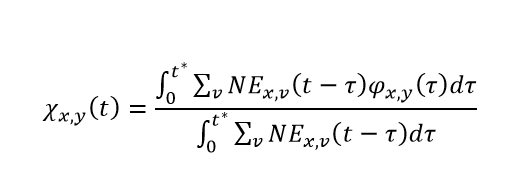
where
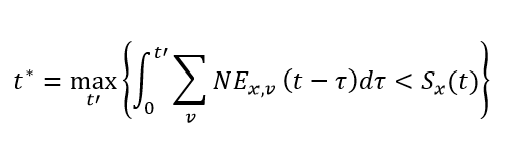
The role of t* is to track individuals who have both entered and exited a susceptible compartment associated with an infection to variant x. It is important to note that for computational feasibility, we assume individuals who were infected the furthest in the past are the ones who will be next infected within each susceptible compartment. Using t*, the denominator of the expression above is the total number of individuals whose most recent infection was with variant x. It is very important to note that the variable χ is not a function of variant round. Due to the considerable computational expense associated with the calculation of χ for each variant-variant combination, we use the average protection derived from natural immunity across all vaccine rounds.
Putting these together, we then get that the effective susceptibility of individuals who were last infected by variant x, are on vaccine round v, and are being challenged by variant y have an average effective susceptibility at time step t of:
Note: we discuss the calculation of ηy,v(t) below in the section on Waning of naturally derived immunity and χy,x(t) in the section on Waning of vaccine-derived immunity.
Transmission intensity and disease severity: Just as the members of each susceptible compartment were compared to individuals in the first susceptible compartment (unvaccinated, never infected) to evaluate relative susceptibility, the infectiousness and disease severity of various infections are likewise calculated as a relative change compared to an ancestral variant infection in an unvaccinated, never infected individual. In Table 2, we list the relative increases to transmission intensity for infections for each variant. We will denote this quantity as kx in our transmission model. These manifest themselves by increasing the underlying force of infection felt by any susceptible individual within a location. It is important to note that alterations to transmission intensity are only a function of variants and not vaccine status (e.g., an individual who has been infected with Delta will contribute the same amount to transmission intensity if they have or have not been vaccinated).
Disease severity, however, is more complex. Disease severity is both a function of infecting variant and vaccine status, brand, and timing of last shot. As with the calculations associated with an individual’s waning immunity to infection, the impacts of variant and vaccine combine multiplicatively to alter the likelihood of severe disease or death.
Final model structure:
For individuals whose last infection was attributable to variant x and who have completed v round of vaccination, we write the system of integro-differential equations that govern their infection dynamics as:
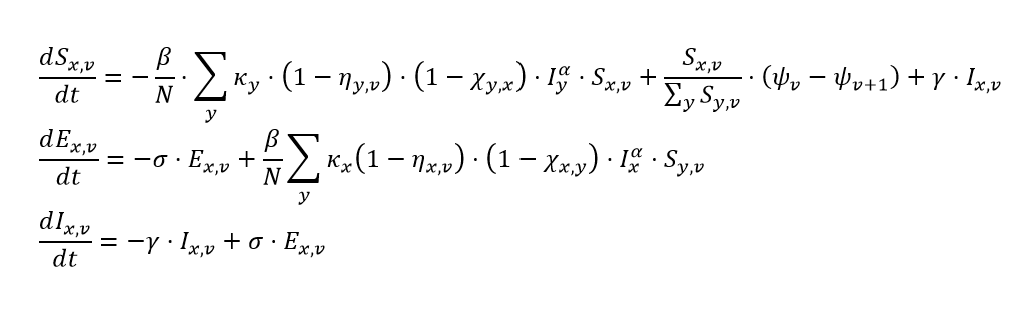
where:
- Sx,v is the number of individuals who are not actively infected or infectious, whose last infection was attributable to variant x, and who are on vaccine round v
- β is the time-varying transmission intensity (for an unvaccinated, never-infected individual)
- N is the total population of the location / age group
- Ky is the variant-specific increase in transmission intensity (increase in β)
- ηy,v, defined above, is the average vaccine-derived protection of individuals in this particular susceptible class to variant y
- χy,x, defined above, is the average natural infection-derived protection against variant y of all susceptible individuals whose last infection was of variant x
- Iy is ΣvIy,v
- Iy,v is the number of individuals who have completed vaccine round v and are actively infectious with variant y
- α is the location-specific mixing parameter
- ψv(t) is Σcψv(t,c)
- ψv(t,c) is the number of individuals who have completed vaccine round v (v = 0,1, or 2) with brand c. Note here that ψ3(t,c) is assumed to be 0 for all vaccine brands.
- ƴ is the reciprocal of the average infectious duration
- Ex,v is the number of individuals who have completed v rounds of vaccine, have been infected with variant x (exposed), but are not yet infectious
- σ is the reciprocal of the average incubation duration
References
1. Discovery Health. Discovery Health, South Africa’s largest private health insurance administrator, releases at-scale, real-world analysis of Omicron outbreak based on 211 000 COVID-19 test results in South Africa, including collaboration with the South Africa. Press Release. https://www.discovery.co.za/corporate/news-room. Published December 14, 2021.
2. Andrews N, Stowe J, Kirsebom F, et al. Effectiveness of COVID-19 vaccines against the Omicron (B.1.1.529) variant of concern. medRxiv. Published online December 14, 2021. doi:10.1101/2021.12.14.21267615
3. UK Health Security Agency. SARS-CoV-2 Variants of Concern and Variants under Investigation in England. Accessed December 21, 2021. https://www.gov.uk/government/publications/investigation-of-sars-cov-2-variants-technical-briefings
4. Pulliam JRC, Schalkwyk C van, Govender N, et al. Increased Risk of SARS-CoV-2 Reinfection Associated with Emergence of the Omicron Variant in South Africa; 2021. doi:10.1101/2021.11.11.21266068
5. Garrett N, Tapley A, Andriesen J, et al. High rate of asymptomatic carriage associated with variant strain omicron. medRxiv. 2021-268130v1-Corey.
6. UK Health Security Agency. Omicron Daily Overview: 20 December 2021;7. https://assets.publishing.service.gov.uk/government/uploads/system/uploads/attachment_data/file/1042543/20211220_OS_Daily_Omicron_Overview.pdf