
What data sources go into the GBD?
Published June 14, 2018
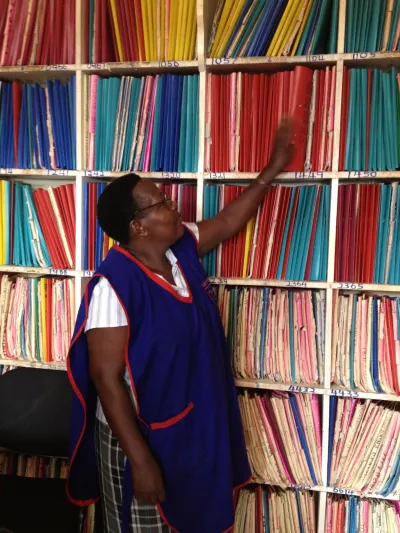
Photo credit: IHME
Estimates are only as strong as the evidence they are built on. The Global Burden of Disease (GBD) study produces millions of estimates of health around the globe, estimates that are informing real-world policy and implementation. That means that they have to be built on good data, and a lot of it.
Why not just rely on a single data source for a given country or disease?
Most data sources do not cover all of the 300-plus causes of death and poor health that GBD looks at. Chances are, you will have to use different sources to get information on the prevalence of diabetes and diarrhea. Then consider that most data sources only cover a narrow slice of time and therefore cannot tell us about the state of health over the whole two decades for which GBD produces estimates. And, on top of that, any single data source might have used distinctive data collection practices, such as having a uniquely enthusiastic interviewer or choosing certain households to interview over others, which could produce different estimates from another survey.
As you combine all of these considerations, you begin to see just how complicated it can be to find the data that allows for global estimates of death and disability.
Thus, in order to produce good estimates, GBD has to pull in a lot of diverse data sources. The GBD estimates published in 2017, covering the years 1990 to 2016, drew from more than 90,000 data sources, and each of those sources in turn had anywhere from hundreds to billions of individual data points – data points that tell the story of illness and health around the world.
What does a “data source” even look like?
As alluded to above, the data sources used in GBD take many forms, and this variety is a key part of the work. For example:
- Censuses share data about every member of a population – of a country, a town – at a single point in time.
- Vital registrations complement the single point in time sources with the ongoing “vital” events, the births and deaths that happen every day.
- Finer detail is provided by other sources such as: disease registries (central databases that collect information on specific diagnoses, such as cancer or diabetes), surveys (both local and international), scientific literature, and a host of other sources large and small.
GBD uses some unusual data sources as well, especially in areas of the world that lack consistent and complete censuses and vital registration systems. Verbal autopsy data, for example, is often used in these situations. Through this method, trained interviewers interview the relatives of a recently deceased person to obtain information on their signs, symptoms, and demographic characteristics in order to determine their cause of death.
This diversity of sources is a key part of both GBD’s existence and its strength. Every country and organization has its own methods and systems for collecting information, and it is important to draw from a range of sources whenever possible to help create a more complete picture of the world’s health.
Where does all this data come from?
Some of the data sources used are publicly available, published in studies or shared on the web by organizations like WHO and countries like Brazil – a country that has made an incredible effort to publicize its national statistics. Other sources are shared by partners or through our 3,000-plus-member network of collaborators, who help us to learn more about these data sources and the context of data collection across different countries and organizations.
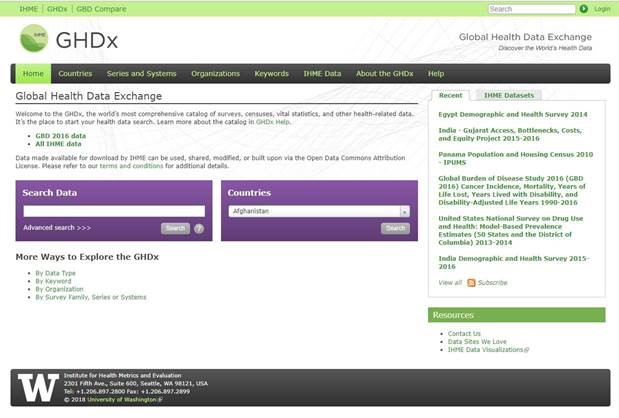
IHME shares information about the datasets used in the GBD study via the Global Health Data Exchange (GHDx). Not only does this increase transparency, but it also helps us to find out if we missed important datasets, so that every year GBD estimates can be more accurate.
But, before it can be cataloged for GHDx or even entered into calculations, each dataset must be evaluated. Data arrives in many forms – formal tables, scanned publications from 30 years ago, large spreadsheet uploads – and a team of data specialists and analysts reviews each file and row to evaluate the quality of each source. We will talk more about what this looks like in our next post!
This post is part of the IHME Foundations series, which discusses some of the core aspects of IHME’s work while exploring along the way everything from how you manage over 50 databases with more than 39 billion rows (and what that even means) to how you help governments in Central America evaluate the impact of their health programs. Join us for the whole series here, or on Medium.