Acting on Data
Discover stories from around the world about the people turning IHME evidence into health impact.
First-time subnational burden of disease estimates in Ethiopia show nationwide improvements but lingering disparities
Ethiopia has made substantial improvements in health over the last three decades across regions and chartered cities, in many ways a model for peer nations. However, progress was not uniform across Ethiopia’s highly diverse, multi-ethnic, and predominantly rural population.

COVID-19 vaccine hesitancy in the US by county and ZIP code
This map uses survey data to show COVID-19 vaccine hesitancy in the US by county and ZIP code, as well as changes in hesitancy over time.

Honoring Black History Month through the lens of health and wellness
We honor Black History Month by sharing some of IHME's recent work addressing racial disparities in health and challenges faced by the Black community.

WHO/Europe and IHME sign agreement cementing collaboration on forecasting of health data
WHO/Europe and the Institute for Health Metrics and Evaluation (IHME) have signed a memorandum of understanding cementing their ongoing collaboration in the areas of health estimates, projections and global health data forecasting.
IHME and WHO collaborate to measure and respond to COVID-19
IHME's COVID-19 estimates have informed responses in two WHO regions: EURO and PAHO.

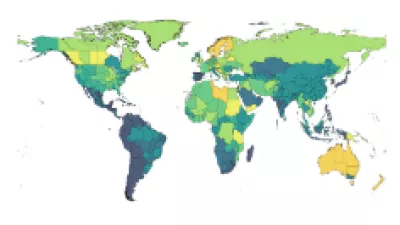
Antimicrobial Awareness Week: Increasing global antibiotic consumption poses a major health threat
As we enter World Antimicrobial Awareness Week, now is the time to take a closer look at the effect of rising antimicrobial drug use on the world.
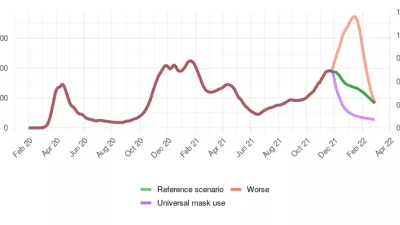
WHO EURO and IHME: Collaboration is critical to address the COVID-19 pandemic and other global health threats
The World Health Organization’s Regional Office for Europe (WHO EURO) has issued a call to action to all health authorities in Europe and Central Asia indicating that the region is once again at the epicenter of the pandemic and urging them to do their utmost to address the COVID-19 surge in the region.

9 Data Visualizations Our Viz Team Loves
Check out the compelling visuals that play a key role in telling data stories.

New Global Burden of Disease analyses show depression and anxiety among the top causes of health loss worldwide, and a significant increase due to the COVID-19 pandemic
In honor of World Mental Health Day, we examine the prevalence of mental disorders worldwide, as well as the impact of the COVID-19 pandemic, and urge countries not to neglect the responsibility of caring for their citizens' mental health.

A new study on police violence finds significant under-reporting of fatalities and greater risks for Black Americans
A new study from IHME analyzed data on police violence in the United States from 1980 to 2021 and found over half of deaths from police violence were misclassified or unreported. The researchers also found disproportionately higher rates of death in Black, Hispanic, and Indigenous people.
Examining the impact: COVID-19 and the Hispanic community
As National Hispanic Heritage Month begins on September 15, there is an opportunity to recognize and scrutinize the disproportionate impact that COVID-19 has had on the Hispanic and Latino American demographic.

A side effect of the COVID-19 pandemic: widespread disruptions of routine vaccination
The COVID-19 pandemic resulted in disruptions to routine health services around the world like childhood vaccinations.
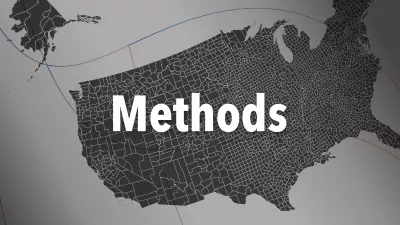
Estimating COVID-19 vaccine hesitancy
We describe how we use survey data to estimate COVID-19 vaccine hesitancy in the United States.

Commemorating this day with the world's most comprehensive tobacco data and research
Commemorating the annual World No Tobacco Day and highlighting the significant toll that tobacco takes on populations with the worlds most comprehensive data and research from the IHME Tobacco Metrics Team the Global Burden of Disease collaboative.
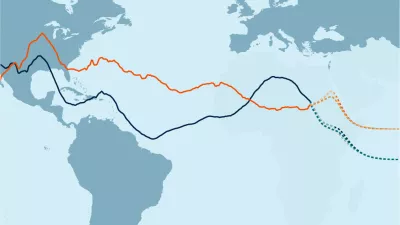
COVID-19 Maps of Mask Use
Maps of mask usage globally, and specifically in the United States, since April 20, 2020