Interactive data visuals
On this page:
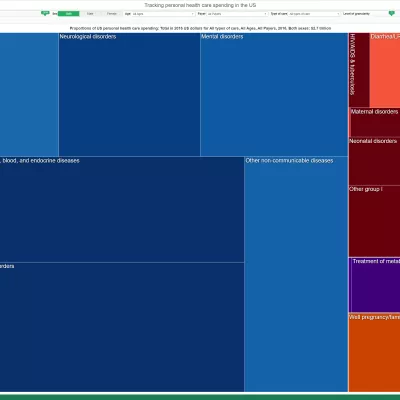
Tracking personal health care spending in the US
Examine US health care spending for 148 conditions for the years 2010 through 2019.
Epi Visualization
Explore data inputs and epidemiological estimates from the GBD 2021 project.
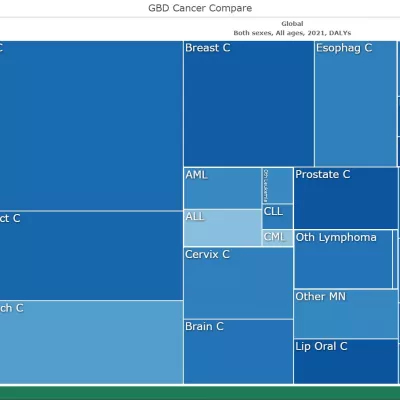
GBD Cancer Compare
Analyze updated data the world’s health levels and trends from 1990 to 2021 from the Global Burden of Disease (GBD) study with a focus on Nonmelanoma Skin Cancers (NMSCs) and cancers without NMSCs aggregates.
GBD Foresight Visualization
Analyze forecasts and better and worse scenarios from 2022 to 2050 for both causes of death and risks, as measured by years of life lost (YLLs), and total deaths.
Burden of Proof
Compare strength of evidence for health risks and outcomes.
GBD Compare
Analyze updated data about the world’s health levels and trends from 1990 to 2021 from the Global Burden of Disease (GBD) study.
GBD Results
View and download estimates of the world’s health from 1990 to 2021.
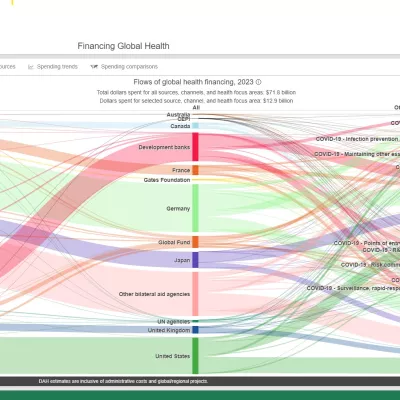
Financing Global Health
Explore patterns of global health financing flows from 1990 to 2050.
Causes of Death (COD) Visualization
See where various data sources have placed trends in causes of death over time for 204 countries and territories.


