Jump to navigation

  • IHME
  • GHDx
  • GBD Compare
Home
Main menu
  • Home
  • Results
    • GBD Results Tool
    • Data Visualizations
    • Country Profiles
    • GBD 2019 Cause and Risk Summaries
    • US Health
    • Policy Reports
    • Research Articles
    • Infographics
    • Topics
    • Data & Tools
  • News & Events
    • News
    • Commentaries
    • Events
    • Videos
    • Acting on Data
    • Collaborator Spotlight
    • Think Global Health
  • Projects
    • COVID-19 resources
    • Global Burden of Disease (GBD)
    • View all
  • Get Involved
    • Donate
    • Careers
    • Call for Collaborators
    • The Roux Prize
    • GBD Emerging Researcher Award
    • Training and Workshops
  • About
    • Vision, Mission, and Principles
    • Statement on racism
    • Senior Management Team
    • Faculty
    • Data Transparency
    • Governance
    • History
    • Our data catalog
    • Terms and Conditions
    • Contact Us

Explore section

Results

  • GBD Results Tool
  • Data Visualizations
  • Country Profiles
  • GBD 2019 Cause and Risk Summaries
  • US Health
  • Policy Reports
  • Research Articles
  • Infographics
  • Topics
  • Data & Tools

Data Visualizations


Subscribe to Data Visualizations | IHME
Advanced
September 22, 2021
Financing Global Health
Data Visualization
Learn more

Explore patterns of global health financing flows from 1990 to 2050 in an updated tool. View trends in global health spending with interactive bar charts, maps, and line graphs. For the first time, see tuberculosis spending estimates for low- and middle-income countries from 2000 to 2017.

map of vaccine hesitancy in the US
June 24, 2021
COVID-19 vaccine hesitancy
Data Visualization
Learn more

This map uses survey data to show COVID-19 vaccine hesitancy in the US by county and ZIP code, as well as changes in hesitancy over time.

January 14, 2021
WHO Rehabilitation Need Estimator
Data Visualization
Learn more

Analyze estimates of the world’s need for rehabilitation services from 1990 to 2019 in this interactive tool. Use maps, line plots, and bar graphs to explore global, regional, and country data on the number of people who would benefit from rehabilitation at least once during the course of their disabling disease or injury based on the Global Burden of Diseases, Injuries, and Risk Factors Study 2019.

January 8, 2021
HIV Mortality – Latin America
Data Visualization
Learn more

Explore local patterns of HIV mortality in Latin America from 2000 to 2017 with this interactive visualization tool. 

December 17, 2020
Tuberculosis
Data Visualization
Learn more

Explore local patterns of tuberculosis prevalence and mortality from 2000 to 2017 with this interactive visualization tool. 

December 16, 2020
MCV Coverage
Data Visualization
Learn more

Explore local patterns of annual childhood MCV1 coverage estimates from 2000 to 2019 with this interactive visualization tool. 

October 15, 2020
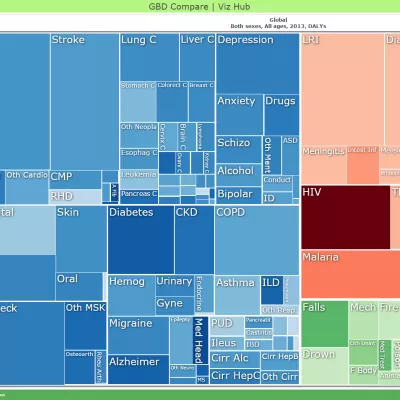
GBD Compare
Data Visualization
Learn more

Analyze updated data about the world’s health levels and trends from 1990 to 2019 in this interactive tool using estimates from the Global Burden of Disease (GBD) study. Compare causes, injuries, and risks within a country, compare countries with regions or the world, and explore patterns and trends by country, age, and gender. 

October 15, 2020
Mortality Visualization
Data Visualization
Learn more

How do input data become GBD estimates? Walk through the estimation process for mortality trends for children and adults for 204 countries and territories using the Mortality visualization. See source and comparative data and step through the stages in the estimation process to reveal the final mortality estimates from 1950 to 2019.

October 15, 2020
Causes of Death (COD) Visualization
Data Visualization
Learn more

Where do we have the best data on different health conditions? For any age group, see where various data sources have placed trends in causes of death over time. You can examine more than 350 causes in both adjusted and pre-adjusted numbers, rates, and percentages for 204 countries and territories.

October 15, 2020
Epi Visualization
Data Visualization
Learn more

With this interactive tool, you can explore data inputs and epidemiological estimates from the GBD 2019 project.

October 15, 2020
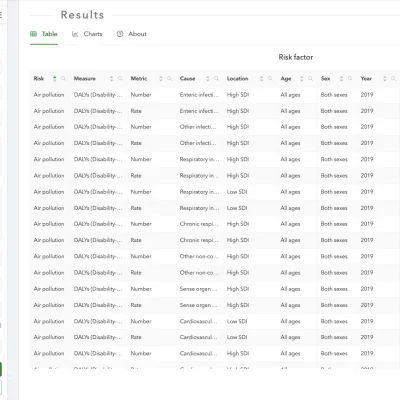
GBD Results
Data Visualization
Learn more

View and download updated estimates of the world’s health for 369 diseases and injuries and 87 risk factors from 1990 to 2019 in this interactive tool.

October 8, 2020
GBD India Compare
Data Visualization
Learn more

Analyze data about India’s health levels and trends from 1990 to 2019 in this interactive tool. Use treemaps, maps, arrow diagrams, and other charts to compare causes and risks and explore patterns and trends by age and sex. Drill from a national view into specific details. Compare expected and observed trends. Watch how disease patterns have changed over time. See which causes of death and disability are having more impact and which are waning.

August 20, 2020
Water, Sanitation, and Hygiene
Data Visualization
Learn more

Explore local patterns of access to drinking water and sanitation facilities from 2000 to 2017 with this interactive visualization tool. 

August 19, 2020
Lymphatic Filariasis
Data Visualization
Learn more

Explore local patterns of lymphatic filariasis infection prevalence globally from 2000 to 2018 with this interactive visualization tool. 

July 22, 2020
Oral Rehydration Therapy
Data Visualization
Learn more

Explore local patterns of coverage of oral rehydration solution (ORS), recommended home fluids (RHF), and oral rehydration therapy (ORT) – the use of either ORS or RHF – from 2000 to 2017 with this interactive visualization tool. 

July 14, 2020
Population Forecasting
Data Visualization
Learn more

Use this dynamic tool to explore patterns in population trends from 2017 to 2100. The interactive tool reveals changes in population structures and fertility rate, based on progress toward SDG pace of female educational attainment and access to contraception.

July 7, 2020
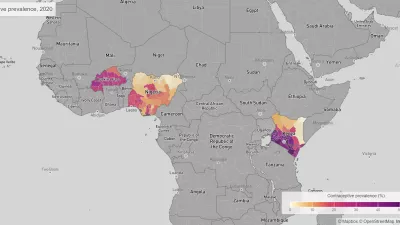
Male Circumcision
Data Visualization
Learn more

Explore local patterns of male circumcision prevalence from 2000 to 2017 with this interactive visualization tool. 

April 20, 2020
Double Burden of Malnutrition
Data Visualization
Learn more

With this dynamic map visualization tool, explore local patterns in child overweight and wasting, from 2000 to 2019. Observe trends at multiple spatial scales and search to view trends in specific countries and local areas. 

March 26, 2020
COVID-19 projections
Data Visualization
Learn more

IHME's COVID-19 projections were developed in response to requests from the University of Washington School of Medicine and other US hospital systems and state governments working to determine when COVID-19 would overwhelm their ability to care for patients. The forecasts show demand for hospital services, reported and excess deaths due to COVID-19, rates of infection and testing, and the impact of social distancing, organized by country and state (for select locations).

January 8, 2020
Child Growth Failure
Data Visualization
Learn more

With this dynamic map visualization tool, explore local patterns in child stunting, wasting, and underweight across all low- and middle-income countries from 2000 to 2017. Observe trends at multiple spatial scales and search to view trends in specific countries and local areas. 

December 25, 2019
Education
Data Visualization
Learn more

With this interactive map visualization, explore local patterns in educational attainment across all low- and middle-income countries from 2000 to 2017. Compare how years of education vary between men and women and across two different age groups. Observe trends at multiple spatial scales and search to view trends in specific countries and local areas.

November 26, 2019
The Importance of Tobacco Control in Mexico
Data Visualization
Learn more

In this data visualization, we examine current and past trends in tobacco use across Mexico to understand where progress has been made and where gaps still exist. Given recent statistical innovations, we can also forecast into the future.

November 12, 2019
Maternal Health Atlas
Data Visualization
Learn more

What are the greatest threats to a mother’s health? Explore causes of death or disability in women, and compare how the biggest threats to maternal health in different countries have changed over time using the Maternal Health Atlas.

October 16, 2019
Under-5 mortality
Data Visualization
Learn more

With this interactive mapping tool, explore localized child, infant, and neonate mortality trends in 99 low- and middle-income countries from 2000 to 2017. Observe trends at different spatial resolutions, examine change over time, and understand the improvement rates needed to achieve the United Nations Sustainable Development Goal (SDG) target for ending preventable child deaths. Drill down to uncover trends in specific countries, districts, and local areas. Easily share maps with others.

October 16, 2019
Child Mortality 2000-2017
Data Visualization
Learn more

In 2000, 9.7 million children died before their 5th birthday. Between 2000 and 2017, global child death rates decreased significantly, saving millions of children. By 2017, the number of child deaths dropped to 5.4 million. Helping children survive and thrive is one of the most important global goals for health and development.


Pages

  • 1
  • 2
  • next ›
  • last »

Results

  • GBD Results Tool
  • Data Visualizations
  • Country Profiles
  • GBD 2019 Cause and Risk Summaries
  • US Health
  • Policy Reports
  • Research Articles
  • Infographics
  • Topics
  • Data & Tools

Stay connected


IHME

Institute for Health Metrics and Evaluation

Population Health Building/Hans Rosling Center

3980 15th Ave. NE, Seattle, WA 98195

UW Campus Box #351615

Tel: +1-206-897-2800

Fax: +1-206-897-2899

© 2022

  • Privacy policy

  • Home
  • Results
    • GBD Results Tool
    • Data Visualizations
    • Country Profiles
    • GBD 2019 Cause and Risk Summaries
    • US Health
    • Policy Reports
    • Research Articles
    • Infographics
    • Topics
    • Data & Tools
  • News & Events
    • News
    • Commentaries
    • Events
    • Videos
    • Acting on Data
    • Collaborator Spotlight
    • Think Global Health
  • Projects
    • COVID-19 resources
    • Global Burden of Disease (GBD)
    • View all
  • Get Involved
    • Donate
    • Careers
    • Call for Collaborators
    • The Roux Prize
    • GBD Emerging Researcher Award
    • Training and Workshops
  • About
    • Vision, Mission, and Principles
    • Statement on racism
    • Senior Management Team
    • Faculty
    • Data Transparency
    • Governance
    • History
    • Our data catalog
    • Terms and Conditions
    • Contact Us